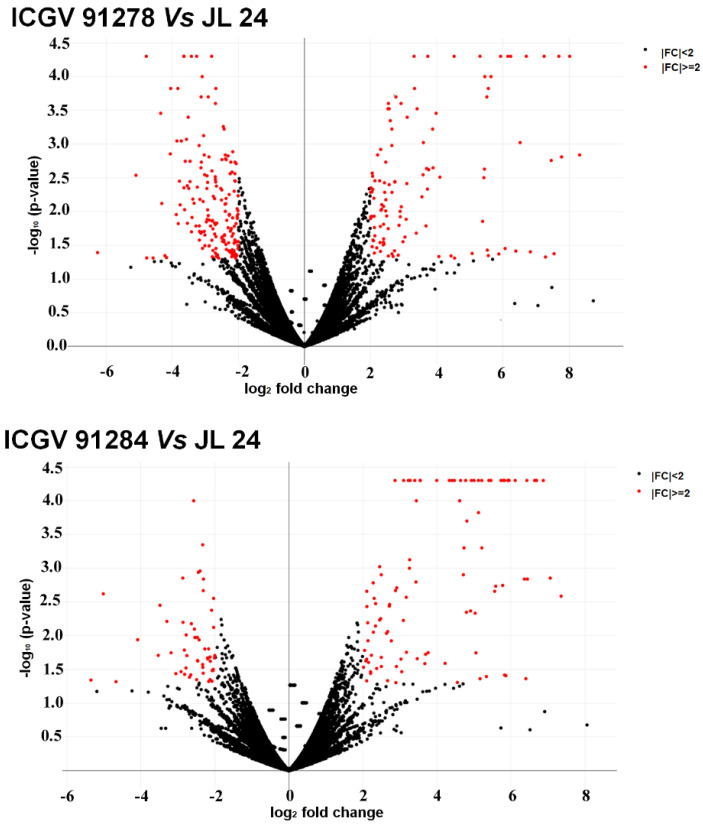
Figure 4.
Volcano plot demonstrating the genes that were differentially expressed between susceptible (JL 24) and resistant genotypes (ICGV 91278, ICGV 91284) under infection conditions. Investigation and representation of DEGs were performed for developing Volcano plot. This plot is between log2 (fold change) and −log10 of the p-value on the x-axis and y-axis, respectively. Here, each dot is representing a gene and black and red coloured dots represent non-significant and significant genes, respectively.

