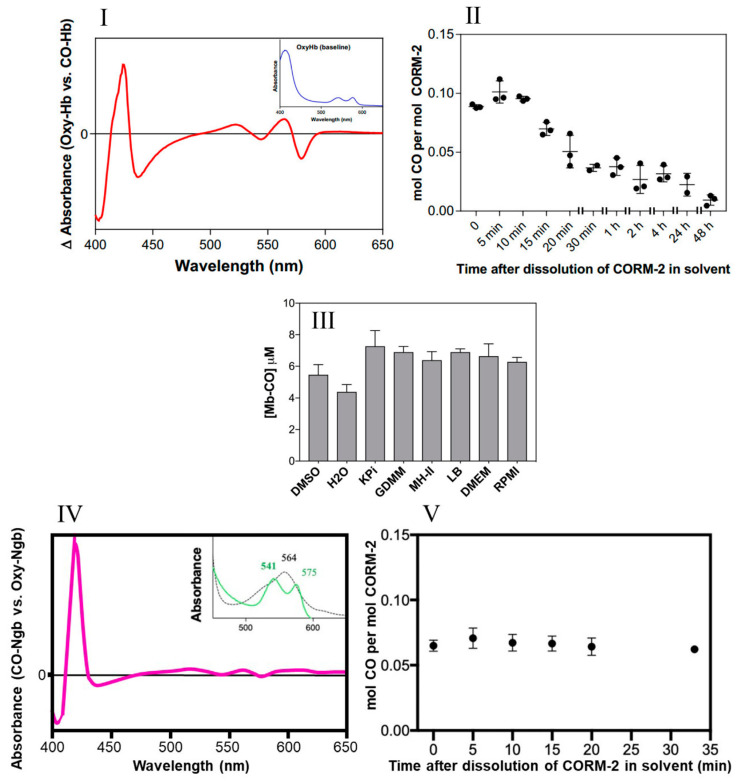
Figure 2.
Little CO is released from CORM-2 in DMSO. (I) CO-difference UV-visible spectrum of CO-saturated haemoglobin with the absolute spectrum of the oxyHb sample (shown in inset) as a baseline. (II) Amount of CO detected as COHb expressed as a function of the age of the CORM-2 stock solution, i.e., time after dissolution of CORM-2 in DMSO (solvent). (III) Maximum yields of Mb-CO from 10 μM CORM-2 as an average of two technical repeats, with SD shown as error bars. CO was detected after prior incubation for 20 min in a 10-fold excess of DMSO, water, KPi, GDMM, MH-II, LB, DMEM or RPMI. (IV) CO-difference UV-visible spectrum of neuroglobin with saturating CORM-2. The inset shows the absolute spectra of the reduced (dotted) and CO-bound forms (green). (V) Amount of CO detected as CO-Ngb expressed as a function of the age of the CORM-2 stock solution, i.e., time after dissolution of CORM-2 in DMSO. Data in II and V display individual data points from 3 independent replicates. Minimal autoxidation of the oxyglobins was established prior to each time point in II and V.

