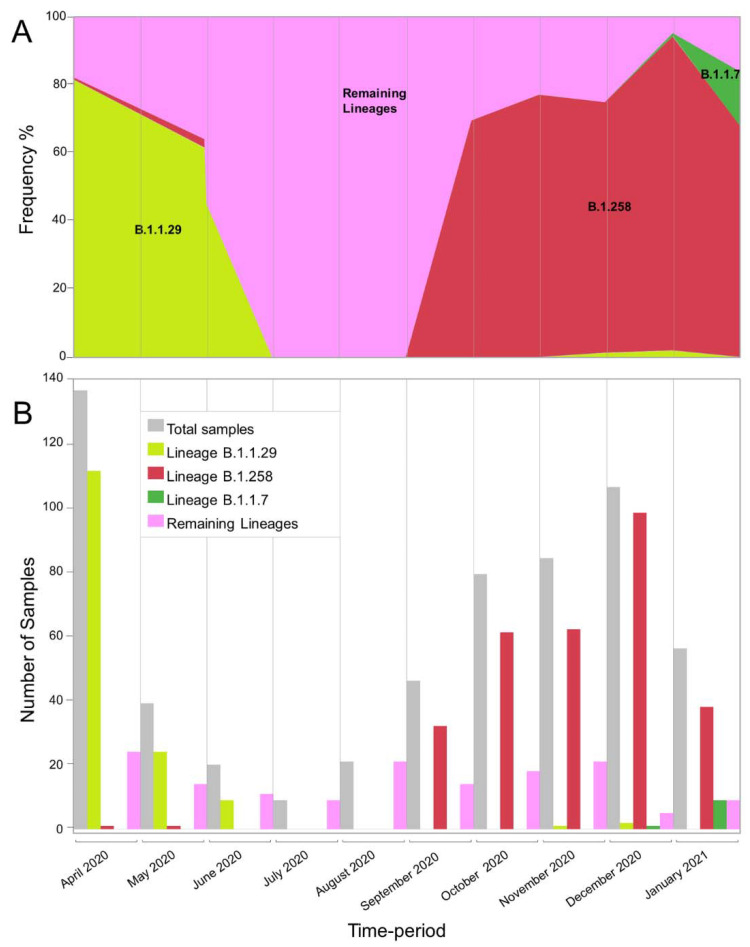
Figure 1.
Graphical representation of the appearance of lineages B.1.1.29, B.1.258 and B.1.1.7 in each month of the sampling period from April 2020 to January 2021. (A) The frequency of the two most prevalent lineages, as well as B.1.1.7, over the 10-month sampling period. The y-axis represents the frequency of samples as percentages, while the x-axis represents the time-period of each month of the sampling period. The samples for lineages B.1.1.29, B.1.258, and B.1.1.7 are shown in light green, red and green, respectively. The numbers of samples in the remaining lineages are shown in pink and were calculated by excluding the monthly samples in the B.1.1.29, B.1.258, and B.1.1.7 lineages from the total number of samples (Table 1). (B) Bar chart indicating the number of samples of the two most prevalent lineages, as well as B.1.1.7, over the 10-month sampling period. The y-axis represents the number of samples that were identified in each month of the sampling period. The total number of samples is shown in gray (indicated in Table 1), and the samples belonging to lineages B.1.1.29, B.1.258, and B.1.1.7 are shown in light green, red and green, respectively. The numbers of samples in the remaining lineages are shown in pink and were calculated by excluding the monthly B.1.1.29, B.1.258, and B.1.1.7 lineage samples from the total number of samples (Table 1). The x-axis represents each month in the sampling period.

