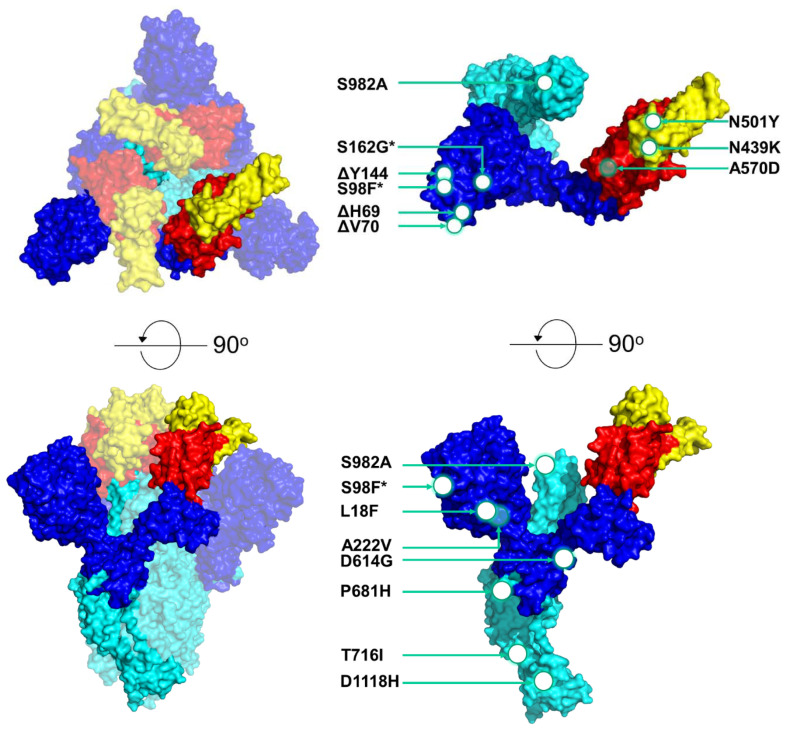
Figure 3.
3D schematic model of the SARS-CoV-2 S protein showing the locations of common mutations/deletions in the most prevalent lineages (B.1.258, B.1.1.29, B.1.177, B.1.2, B.1 and B.1.1.7) in Cyprus. The model was produced by PyMol (Version 2.4.1, Schrödinger, LLC, https://www.pymol.org, accessed on 18 February 2021) and is based on data derived and adapted from Protein Data Bank entry 6XEY [49]. On the left side, the S protein trimer is shown as a transparent surface representation (transparency 0.5), but the S protein monomer is not transparent. On the upper-left side of the figure, the top of the protein is depicted, and on the lower-left side, the S protein has been rotated at a 90-degree angle to show the side view. On the right side of the figure, the S protein monomer is depicted in the upper right showing the top view, and the lower right side shows the side view of the monomer. Circles and arrows indicate the approximate locations of the common S-protein mutations/deletions identified in the most prevalent lineages (B.1.258, B.1.1.29, B.1.177, B.1.2, B.1 and B.1.1.7) in Cyprus in this study. White circles represent mutations/deletions on the outer surface, while open circles represent mutations within the protein or on the backside of the protein. Asterisks represent mutations/deletions that were found in approximately half of the sequences in the B.1.1.7 lineage; S98F was found in 5/10 sequences, and S162G was found in 4/10 sequences. The colored domains are RBDs. RBD, receptor-binding domain (red); RBM, receptor-binding motif (yellow); SD1, subdomain 1; SD2, subdomain 2; FP, fusion peptide; S1, subunit 1 (blue); S2, subunit 2 (cyan). Since this field is still under global scientific investigation, a number of published sources, including the UniProt entry P0DTC2, were used to identify each domain along with their start and end locations [50,51,52,53,54,55,56,57,58,59].

