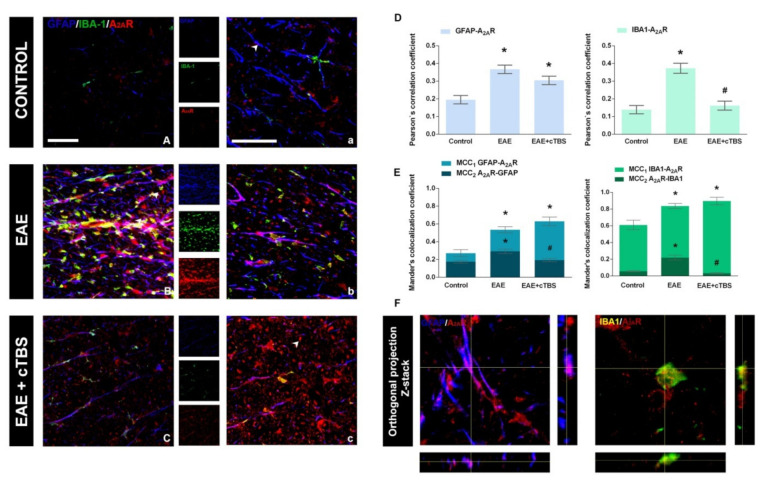
Figure 9.
Effects of CTBS treatment on A2AR expression in lumbar spinal cords of EAE rats. Triple immunofluorescence labeling directed to astrocyte marker GFAP (blue), microglial marker IBA-1 (green), and A2AR (red). In control sections, faint staining of A2AR-ir was observed (A,a). A prominent increase in A2AR-ir was observed in EAE, both in association with GFAP- and IBA-1-ir (B,b). The CTBS treatment decreased the overall intensity of A2AR-ir in the gray matter and was reduced on glial cells, but an increase in staining was detected in non-glial elements (C,c). Pearson correlation coefficients (PCC) indicating the level of signal overlap between GFAP-ir and A2AR-ir and IBA-1-ir and A2AR-ir. Bars show mean PCC ± SEM, from 7–9 images/animal (D). Mander’s colocalization coefficient (MCC) indicating level of signal colocalization between GFAP/A2AR (MCC1, light blue), A2AR/GFAP (MCC2, dark blue), IBA-1/A2AR (MCC1, light green), and A2AR/IBA1 (MCC2, dark green) Bars show mean MCC ± SEM, from 7–9 images/animal (E). Orthogonal Z-stack projection of GFAP/A2AR and IBA-1/A2AR (F). Level of significance: * p ˂ 0.05 or less when compared to control, # p ˂ 0.05 when compared to EAE. Scale bar corresponds to 50 μm.

