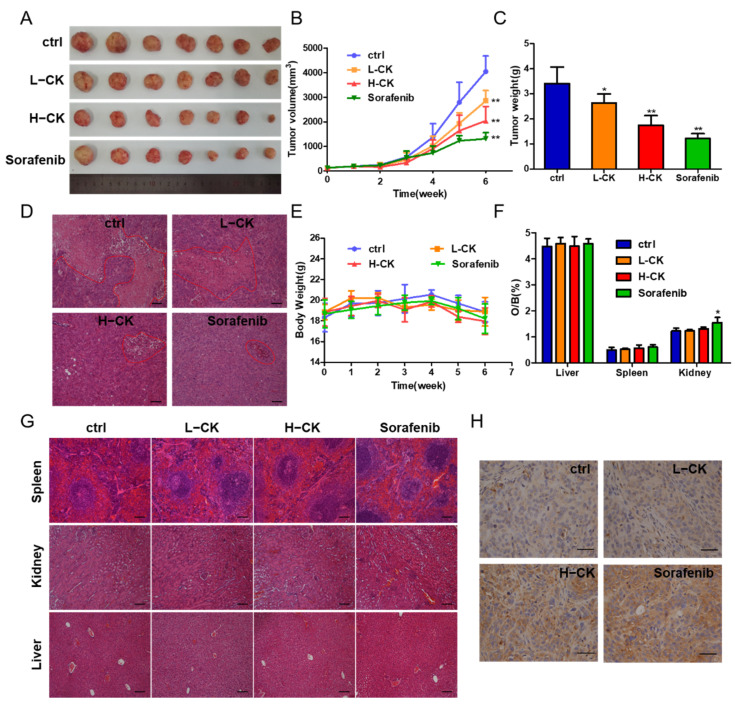
Figure 3.
Ginsenoside CK inhibited the growth of HCC cell xenografts in vivo. (A) Photograph of tumors from four groups (control group, CK treated group and sorafenib treated group). Sorafenib was used as positive control. (B) Tumor volume of the xenograft models was measured every week during the experiments. (C) Tumor weight of the xenograft models at the end of the experiment. (D) HE staining showing tumor necrosis (marked with red lines). Magnification, 100×. (E) Body weight of the nude mice was measured every week during the experiment. (F) Ratio of weight of main organs to body weight of mice. (G) HE staining showing the main organs of xenograft models, magnification 100×. (H) Photographs of p53 immunohistochemical (IHC) stained tumor sections, magnification 400×. All quantitative data were represented as mean ± SD, n = 7. * p < 0.05, ** p < 0.01 vs. control group.

