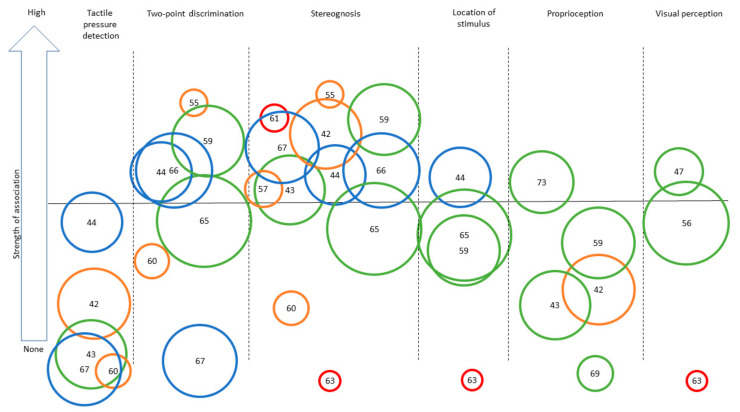
Figure 3.
Synthesis of the strength of the association found across studies assessing different sensory outcomes in relation to bilateral motor performance. Legend: Each number represents an article (as identified in the references list). Only categories with more than three articles for BMF are represented to ensure legibility. Level of evidence is represented by the circle color: Green = very high quality study, blue = high quality study, orange = moderate quality study, yellow = low quality study, red = very low quality study. Size of the circle represents the number of participants included in each study (for example, a larger circle means more participants included). The same numbers are used for Figure 2 and Figure 3: [42], Arnould et al. (2014); [43], Arnould et al. (2007); [44], Auld et al. (2012); [46], Bumin et al. (2010); [47], Burtner et al. (2006); [49], Cooper et al. (1995); [50], Duque et al. (2003); [51], Eliasson et al. (1995); [52], Gordon et al. (1999); [53], Gordon et al. (2006); [54], Guedin et al. (2018); [55], Gupta et al. (2017); [56], James et al. 2015; [55], James et al. (2017); [58], Kinnucan et al. (2010); [59], Klingels et al. (2012); [60], Krumlinde-Sundholm et al. (2002); [61], Kurtaran et al. (2015); [62], Law et al. (2008); [63], O’Malley et al. (1977); [64], Robert et al. (2013); [65], Russo et al. (2019); [66], Sakzewski et al. (2010); [67], Simon-Martinez et al. (2018); [69], Woodward et al. (2015); [71], de Campos et al. (2014); [72], Guzzetta et al. (2006); [73], Kuczynski et al. (2016); [74], van Roon et al. (2005).

