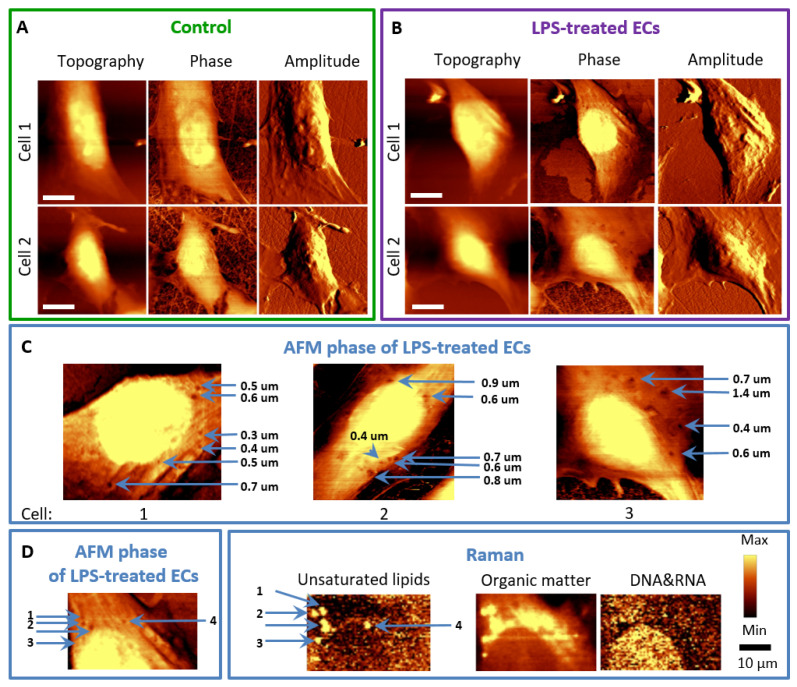
Figure 3.
AFM and Raman imaging of endothelial cells incubated with LPS. Representative images of the topography, phase, and amplitude of control HMEC-1 cells (A) and stimulated with LPS at a concentration of 10 μg·mL−1 for 24 h (B). The arrows (C) indicate the locations of concaves in the phase images of LPS-treated cells. Phase and topography AFM image as well as Raman images showing co-localized changes in the cell membrane and inside of the cell (D).

