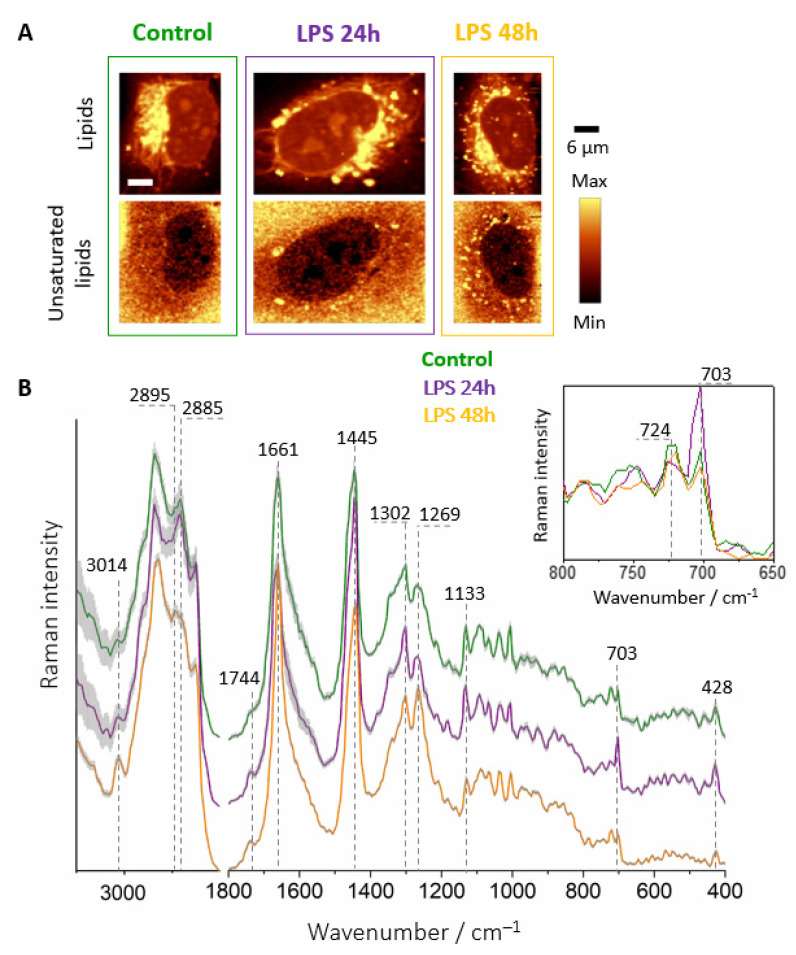
Figure 4.
Raman imaging of LDs in endothelial cells. Representative Raman images of control and incubated with LPS (10 μg·mL−1) HMEC-1 for 24 and 48 h (A) in FBS supplemented media and Raman spectra of LDs (B) extracted from control and LPS-stimulated cells for 24 h (violet) and 48 h (gold) averaged over all measured cells. The insert shows changes in the intensity of the bands at 724 and 704 cm−1. Spectra were normalized in the 1500–400 cm−1 spectral range and were presented with the standard error on each data point (grey area), and have been shifted vertically for clarity.

