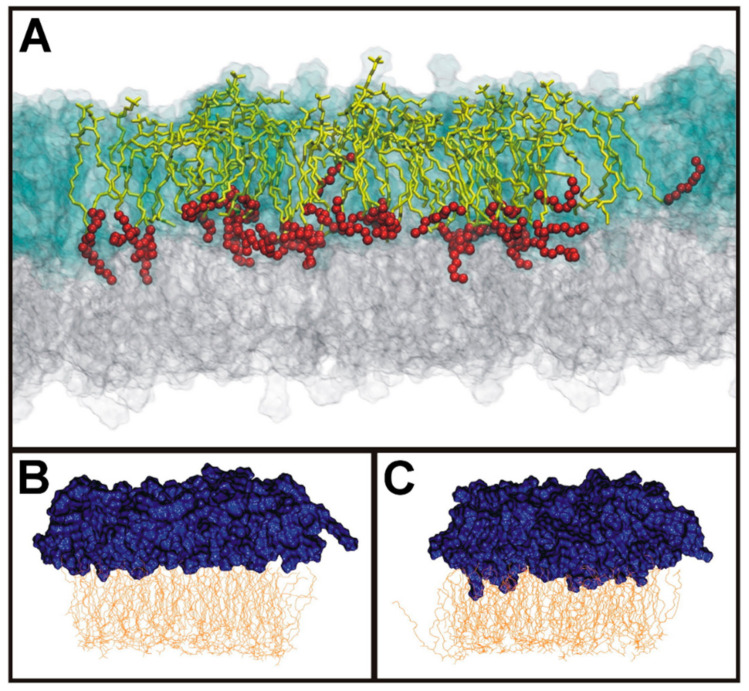
Figure 7.
Illustration of interdigitation between the 2 membrane leaflets. (A) Multicomponent bilayer where SM d18:1/24:0 are shown as yellow sticks with the 8 last carbon atoms depicted as red balls. Lipids in the outer leaflet are shown as transparent blue glass and lipids in the inner leaflet as transparent grey glass. For clarity, SM d18:1/24:0 are marked only in the central part. (B) Model of a bilayer SM d18:1/16:0 and cholesterol in the outer leaflet and with PS 18:0/18:1 and cholesterol in the inner leaflet. (C) Similar to (B), but SM d18:1/16:0 has been exchanged with SM d18:1/24:0. Blue color is used for the outer leaflet and yellow color is used for the inner leaflet. Note that the N-amidated fatty acyl groups in (C) penetrate deeper into the opposite leaflet than in (B). For more details, see the open-access article [141] from where this figure is reproduced.

