Figure 3.

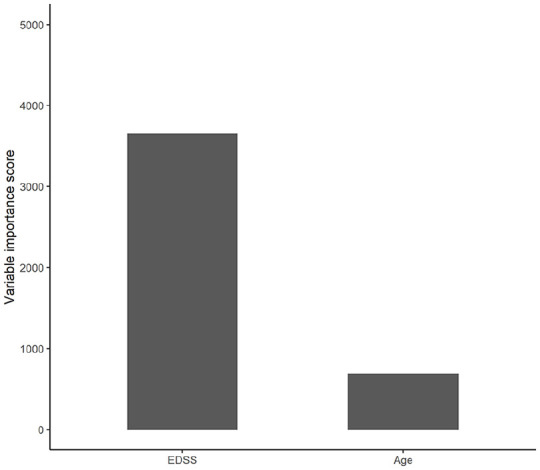
Variable importance plot generated in the decision tree indicating the relative importance of the two predictor variables.

Variable importance plot generated in the decision tree indicating the relative importance of the two predictor variables.