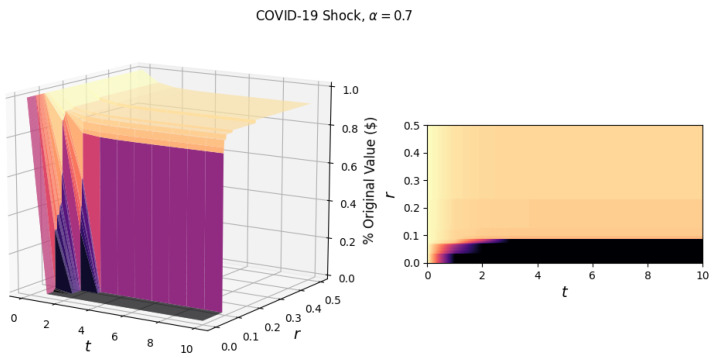
Figure 5.
The surface above shows the response of the network to the Covid-19 shock. The resiliency axis, r, shows a total network collapse for values of , where the critical resilience . A closer look at the region can be found in Appendix A, (Figure A1).

