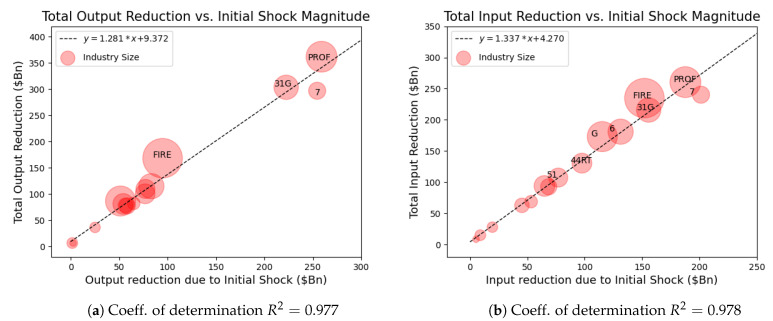
Figure 6.
Comparison of the damage experienced by each industry for the region of no industry failure () due to the Covid-19 shock. All axes are in billions of dollars; , . (a) Plot of the total reduction in output for each industry as a function of the initial shock to input. (b) Plot of the total reduction in input for each industry as a function of the initial shock to input.

