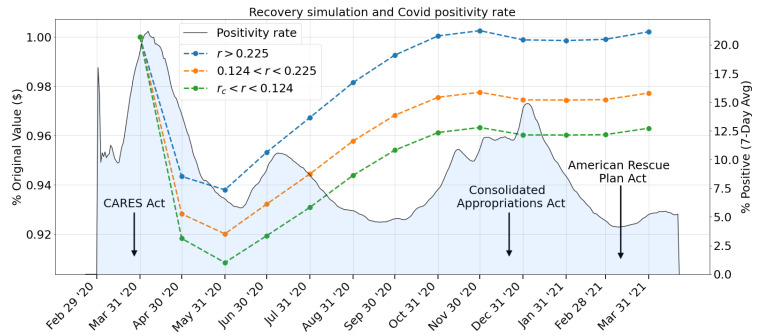
Figure 11.
Comparison of the network response (dashed lines, left vertical axis) with the Covid-19 positivity rates in the U.S. (solid line, right vertical axis). The network response is shown as a projection in the (z,t) plane of Figure 10 and is indexed relative to the March 2020 output levels. The dates of signing the three U.S. stimulus packages are indicated: the CARES Act—27 March 2020, Consolidated Appropriations Act—21 December 2020, and American Rescue Plan Act—11 March 2021. Covid-19 positive testing data provided by the Center for Disease Control and Prevention (CDC).

