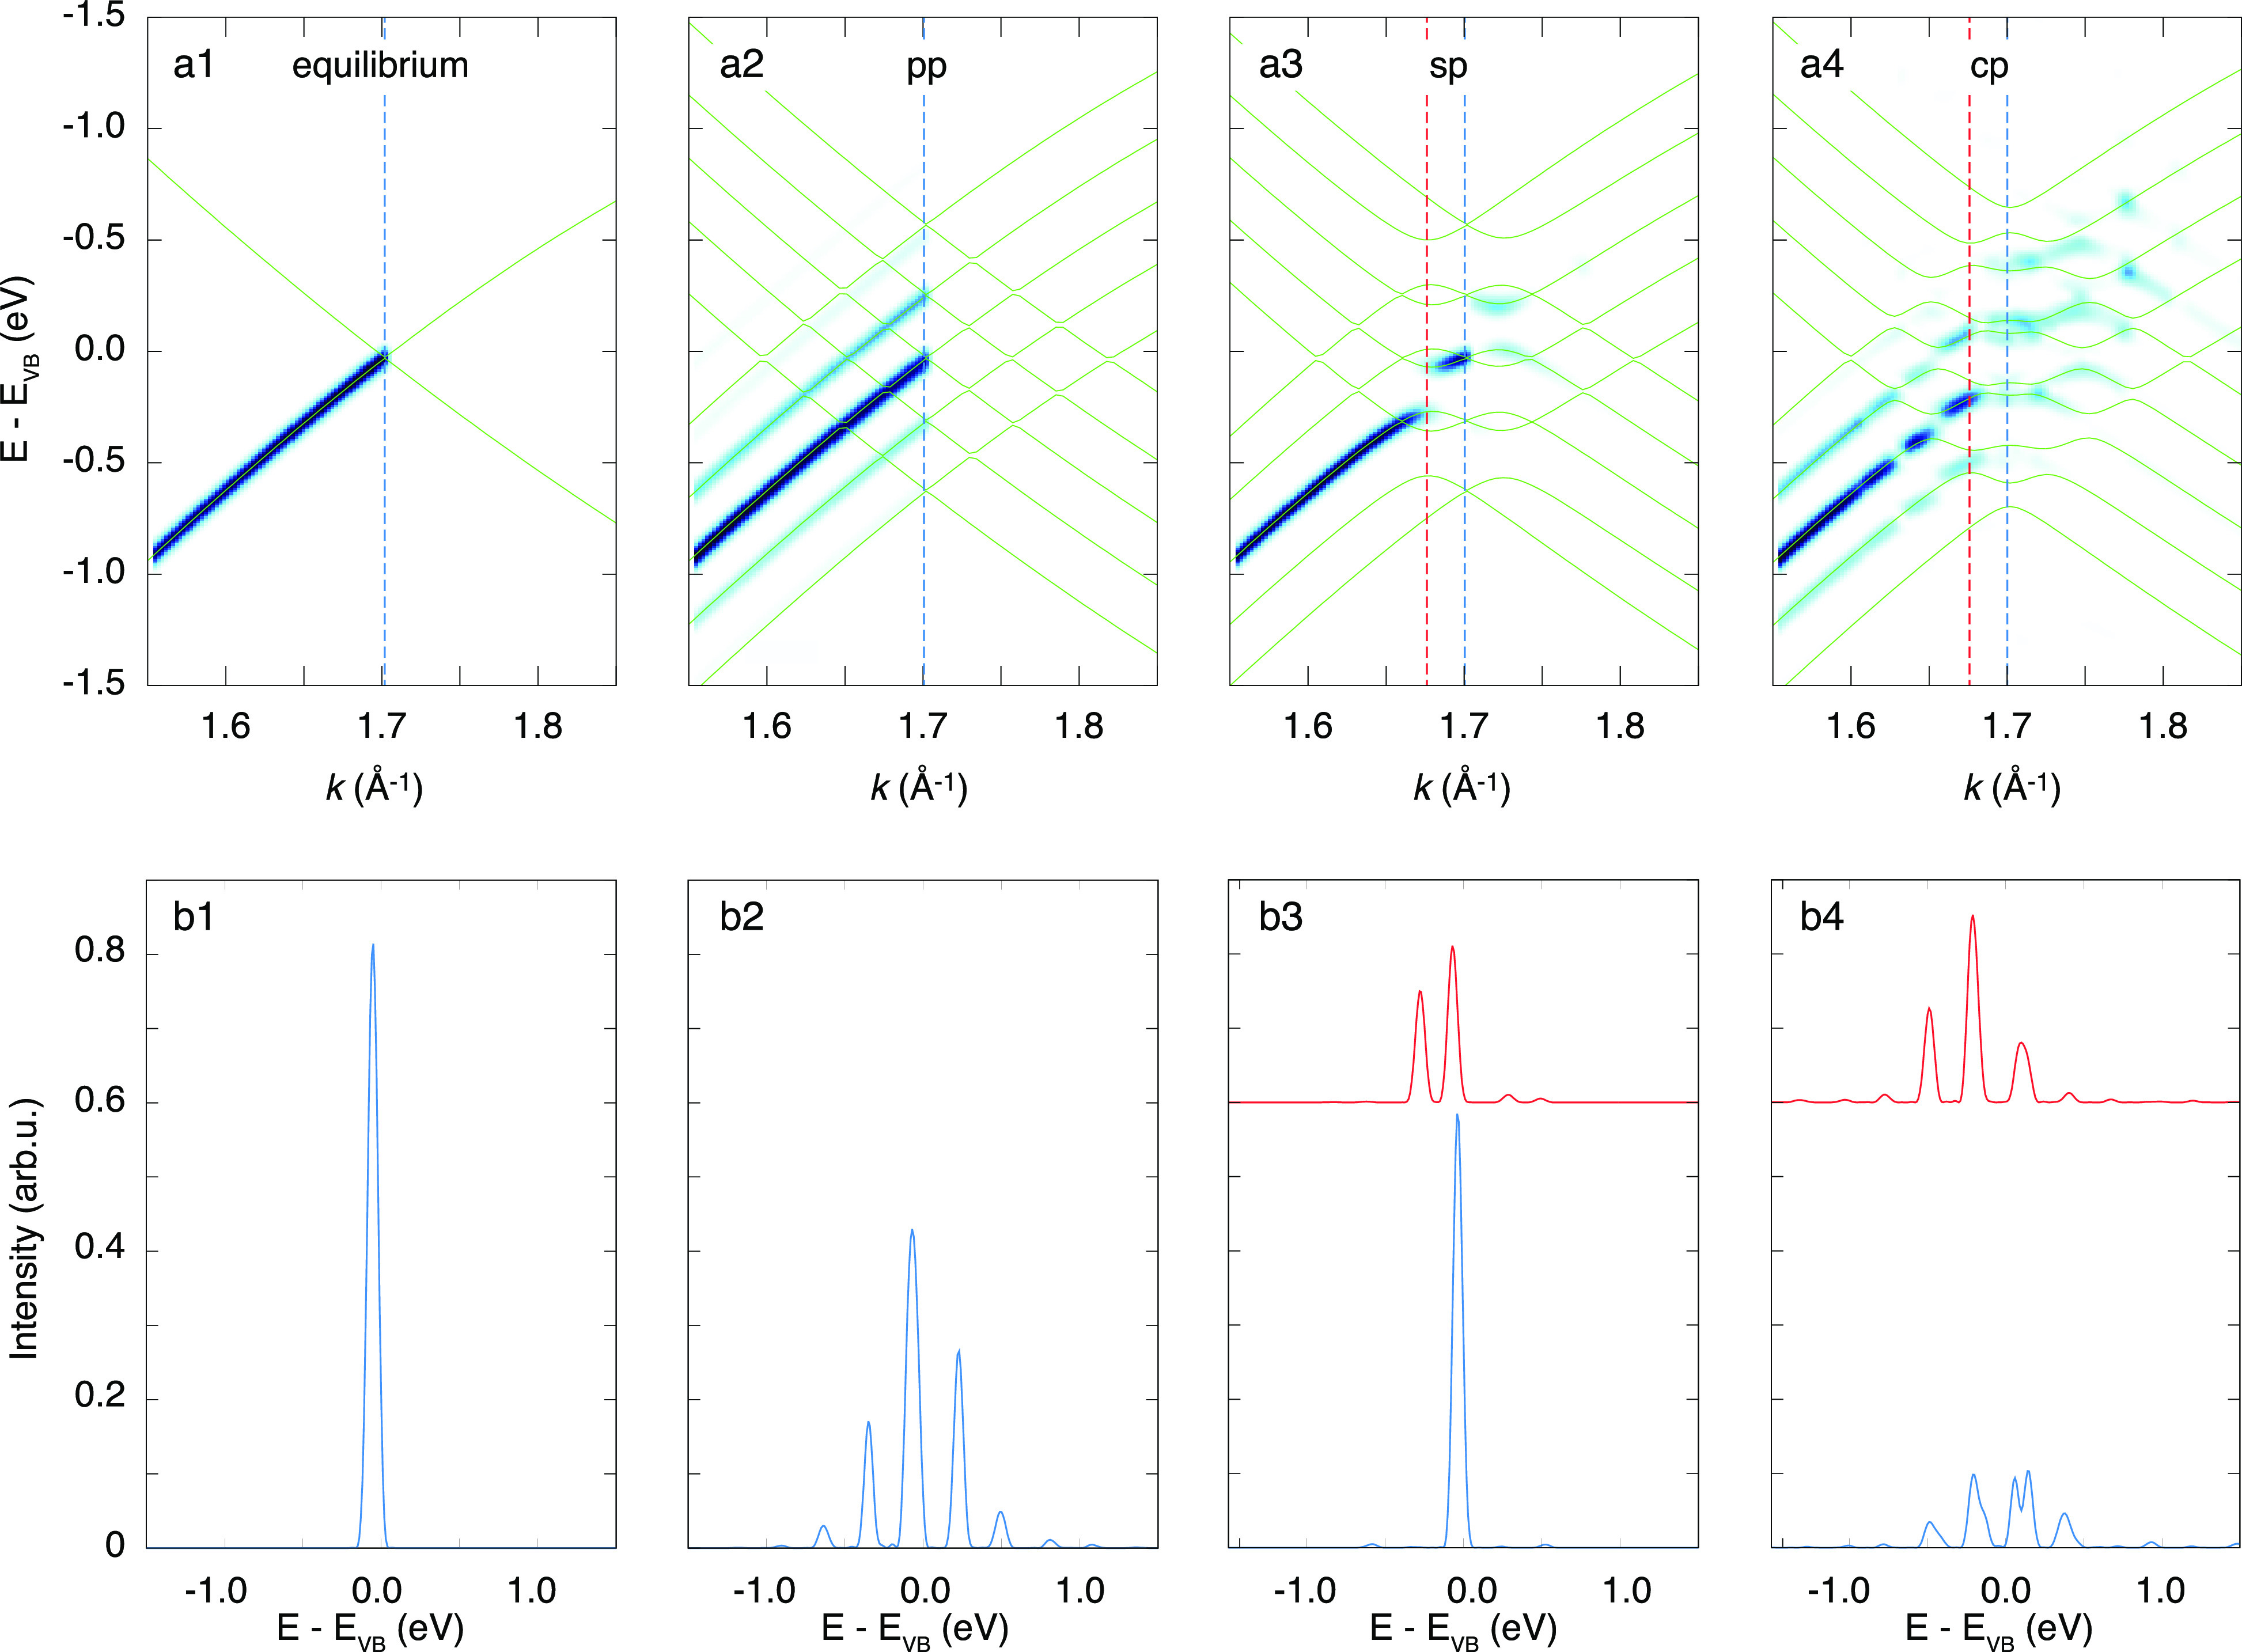
Figure 3.

Simulated ARPES spectra for graphene together with initial state spectra (green lines) at equilibrium (a1), in the presence of a pp driving pulse (a2), in the presence of an sp driving pulse (a3), and in the presence of a cp driving pulse (a4). Blue and red dashed lines indicate the positions for the energy distribution curves (EDCs) in panels b1-b4. EDC through the Dirac point at equilibrium (b1), and in the presence of a pp driving pulse (b2). EDC through the Dirac point (blue) and at the position where the Rabi splitting is most pronounced (red) in the presence of an sp driving pulse (b3) and in the presence of a cp driving pulse (b4).
