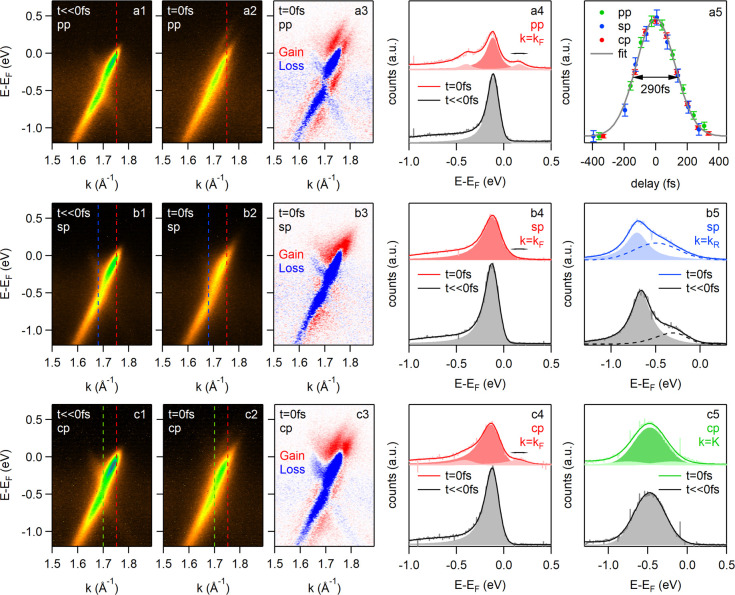
Figure 4.
Rows a, b, and c show the tr-ARPES data for graphene for pp, sp, and cp driving pulses, respectively, at ℏωdrive = 280 meV with a peak driving field of Evac = 2.2 MV/cm. Columns 1 and 2 show the photocurrent at negative pump–probe delay and at t = 0 fs, respectively. Dashed lines mark the positions for the energy distribution curves (EDCs) in columns 4 and 5. Column 3 shows the drive-induced changes of the photocurrent at t = 0 fs. These data were obtained by subtracting the data in column 1 from the data in column 2. Column 4 shows EDCs at the Fermi momenta from column 1 and 2 together with Lorentzian fits. The data points in panel a5 were obtained by integrating the transient EDCs in column 4 over the energy range indicated by the black arrows. The gray line in a5 is a Gaussian fit. b5 shows EDCs through the Dirac point in b1 and b2 together with Gaussian fits. The dashed lines correspond to the second branch of the Dirac cone the intensity of which is suppressed because of photoemission matrix element effects. c5 shows EDCs at the momenta where the Rabi splitting is expected to occur in c1 and c2 together with Lorentzian fits. Filled gray areas show the individual peaks at negative delay. Filled light (dark) colored areas show the individual peaks of the sidebands (main bands).

