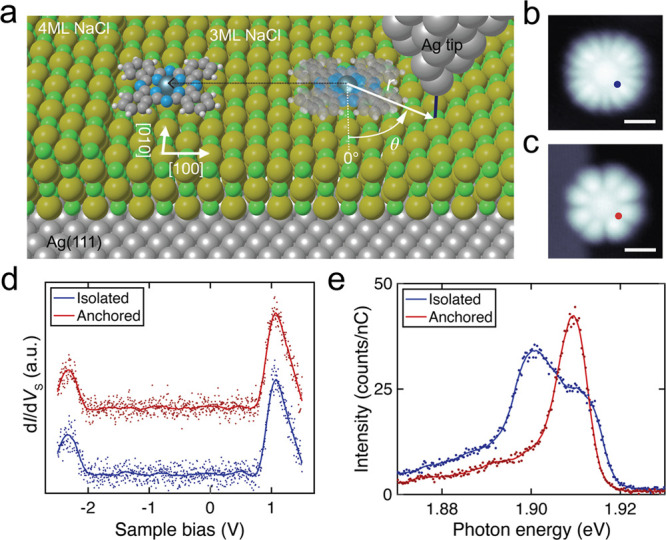
Figure 1.

Isolated vs anchored ZnPc on 3 ML NaCl/Ag(111). (a) Schematics of STM-LE and manipulation experiments. The structural model illustrates the ±11° shuttling between two adsorption orientations for isolated ZnPc (right), which is suppressed for anchored ZnPc (left). The lateral molecule–tip distance r and azimuthal angle θ are defined from the ZnPc center, with θ = 0° defined downward along the NaCl [010] direction as displayed. (b) Constant-current STM image of an isolated ZnPc before manipulation, and (c) anchored ZnPc after moving it to a 4 ML NaCl step edge (VS = −2.5 V, I = 5.5 pA, scale bars = 1 nm). (d) STS of the isolated and anchored ZnPc. (e) STM-LE spectra of the isolated and the anchored ZnPc (VS = −2.5 V, I = 100 pA, acquisition time t = 180 s) measured at the positions marked in (b) and (c). Solid lines in (d) and (e) are 80-point and 20-point Savitzky–Golay filtered curves of the raw data, respectively.
