Figure 4.
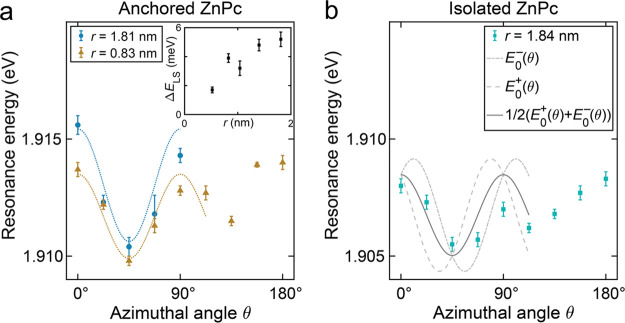
Analysis of the LSM for anchored vs isolated ZnPc. (a) Azimuthal angle dependence of the Q(0,0) resonance for anchored ZnPc at r = 0.83 nm (orange triangles) and r = 1.81 nm (blue circles). A cosine fit yields peak-to-peak amplitudes 2A = ΔELS. The inset shows a summary of the radius-dependent ΔELS for various r. (b) Azimuthal angle dependence of the Q(0,0) resonance for isolated ZnPc at r = 1.84 nm (light-blue squares). The gray dashed lines are model curves based on results from (a) for assumed azimuthal angles of −11° and +11°, respectively. Their superposition (solid gray line) reflects the expected LSM in the case of rapid shuttling. The model agrees well with the raw data.

