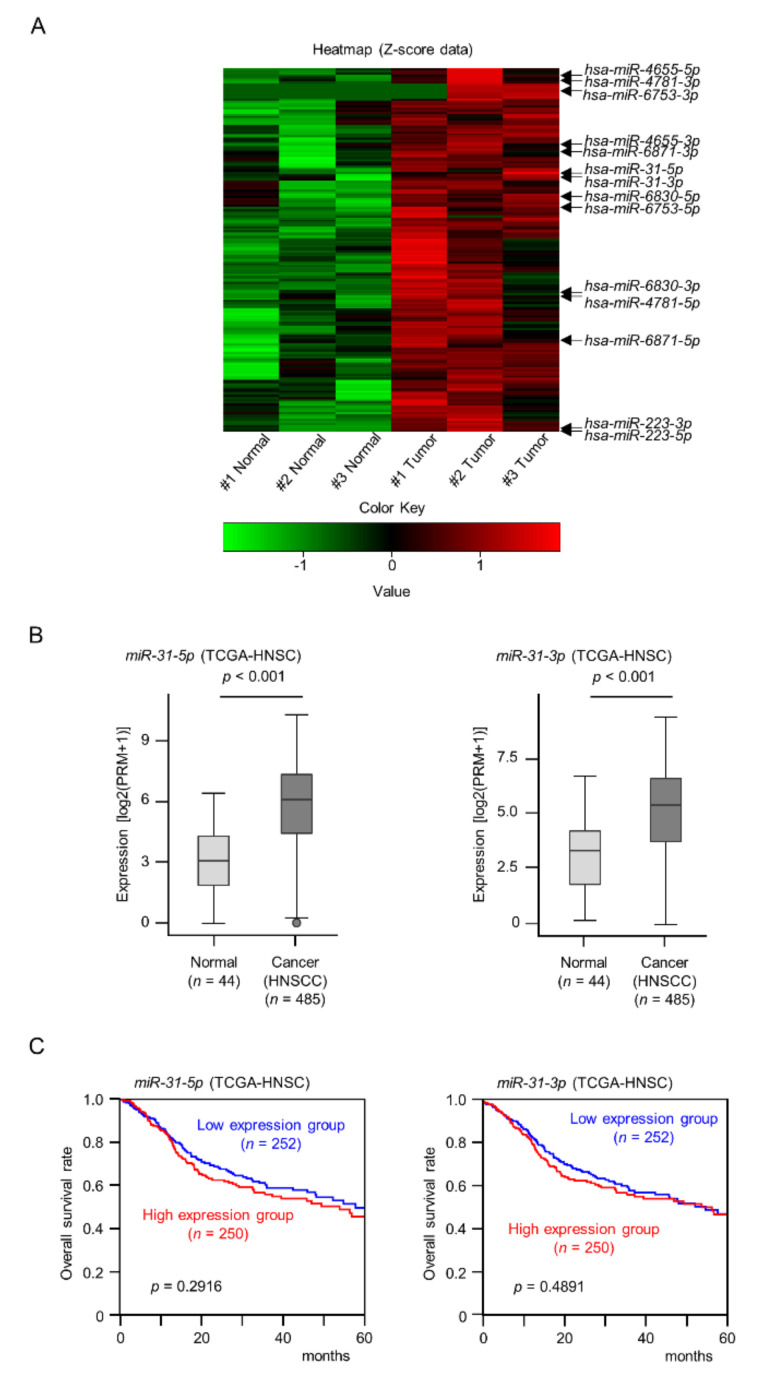
Figure 1.
Clinical significance of miR-31-5p and miR-31-3p expression in HNSCC clinical specimens. (A) Heat maps of the 168 upregulated miRNAs in HNSCC clinical specimens. The color scale was based on Z-score of miRNA-seq expression data. (B) Expression levels of miR-31-5p and miR-31-3p were evaluated using TCGA-HNSC data. (C) Kaplan–Meier survival analyses of HNSCC patients using data from TCGA-HNSC. Patients were divided into two groups according to the median miRNA expression level: high and low expression groups. The red and blue lines represent the high and low expression groups, respectively.

