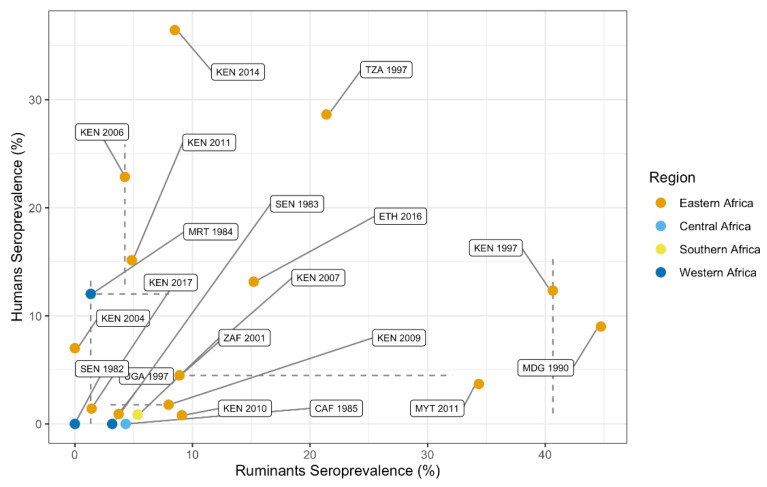
Figure 6.
Animal and human RVF seroprevalence data from the same year and country. Point estimates represent mean seropositivity (percent of individuals testing positive of the total number of individuals tested) by country and year. The point estimates are color-coded by region. Lines represent the range in seroprevalence estimates reported when multiple publications were included in the prevalence estimate.

