Figure 3.
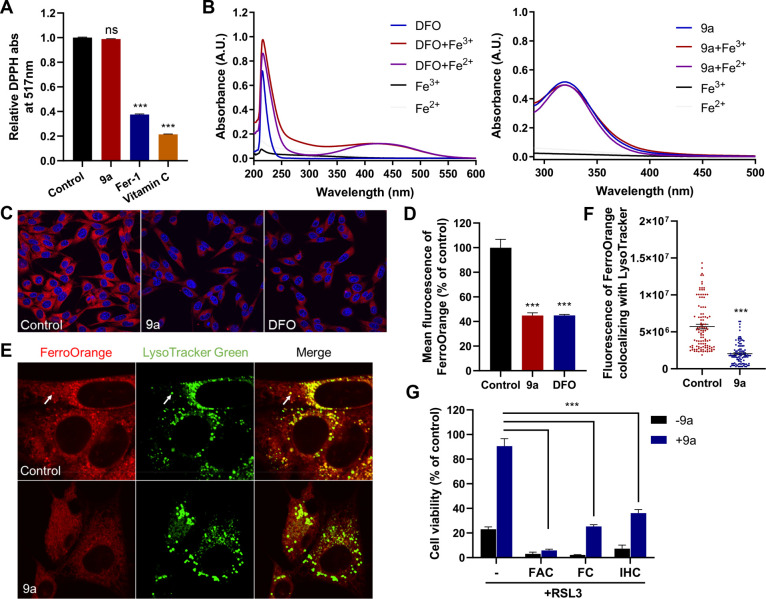
Compound 9a reduces the amount of bioavailable ferrous iron to block ferroptosis. (A) Cell-free antioxidant potential monitored by changes in the absorbance at 517 nm of the stable radical DPPH. The concentration of all tested compounds was 50 μM. Data shown represent the mean ± SEM from three independent experiments; ns, not significant; ***p < 0.001. (B) UV–vis absorption spectra of DFO and 9a in the absence or presence of Fe3+ or Fe2+. (C) Confocal imaging of FerroOrange (red) in HT22 cells treated with 0.5 μM 9a or 50 μM DFO for 6 h. Nuclei were stained with Hoechst 33342 (blue). (D) Quantification of the fluorescence intensity of FerroOrange. (E) Confocal imaging of FerroOrange (red) and LysoTracker Green (green) in HT22 cells treated with 0.5 μM 9a for 6 h. The images show the subcellular localization of Fe2+ in live cells. LysoTracker Green stains the lysosomes. (F) Quantification of the fluorescence intensity of FerroOrange colocalized with LysoTracker Green per cell. Approximately 100 cells were measured per condition. (G) Cell viability of HT22 cells treated as indicated. In the absence or presence of 0.5 μM 9a, cells were treated with 1 μM RSL3 ± 10 μg/mL ferric ammonium citrate (FAC), 25 μM ferric citrate (FC), or 20 μM iron chloride hexahydrate (IHC) for 12 h. (D, F, and G) Data shown represent the mean ± SEM from three independent experiments; ***p < 0.001.

