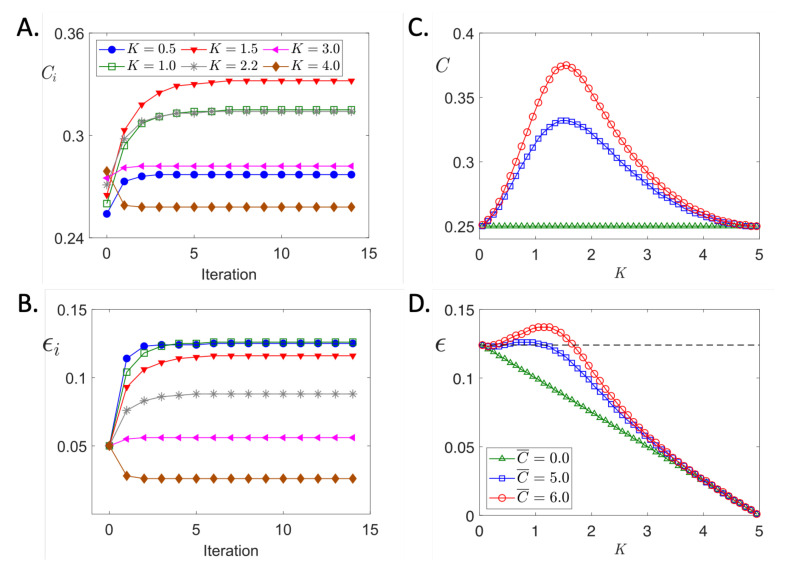
Figure 4.
Predicted Ca transient amplitude and cell strain dependence on gel stiffness. (A) Shows the time evolution of CaT for values of K indicated in the legend. (B) Time evolution of cell strain starting at a value of . Curve labels as in (A). (C) Gel stiffness dependence of steady state values of CaT for different MCT amplifications set by values of given in the legend of panel (D). (D) Similar to panel (C) but cell strains are shown. Simulation parameters: , (except as noted), , .

