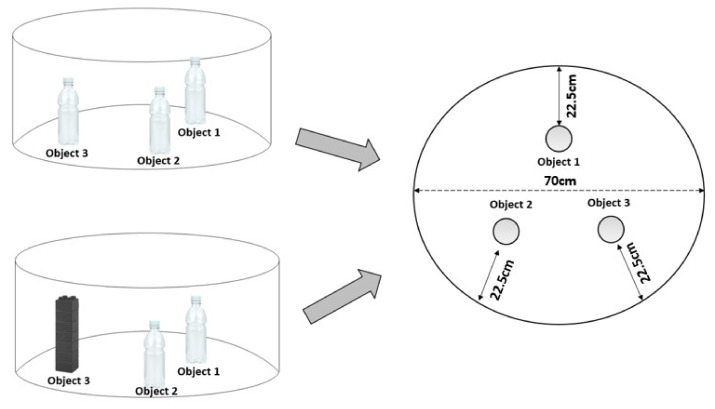
Figure 2.
Graphical representation of the NOR arena. The left-top image represents the organisation of the object on the sample (familiarisation) day. The left-bottom image represents the organisation of the objects on the test day (novel object in the position of object 3). The right image shows the equal distances of the object to the wall of the circular arena.

