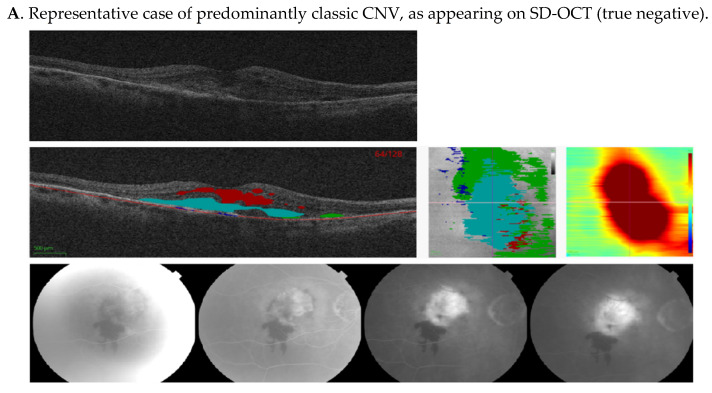
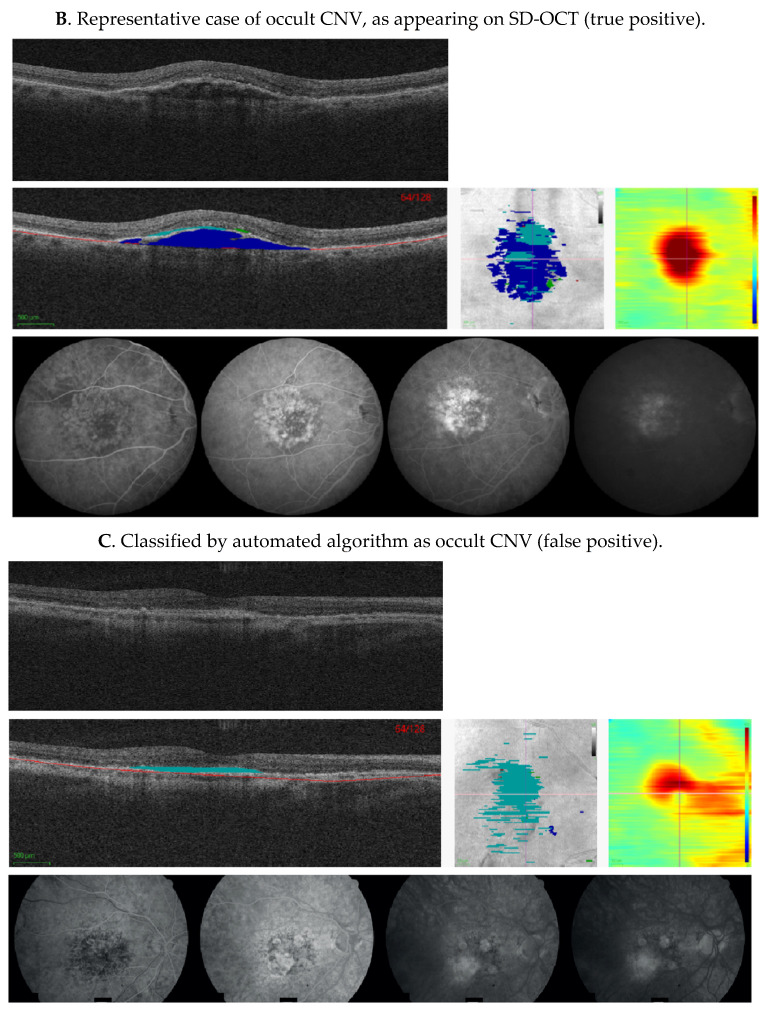
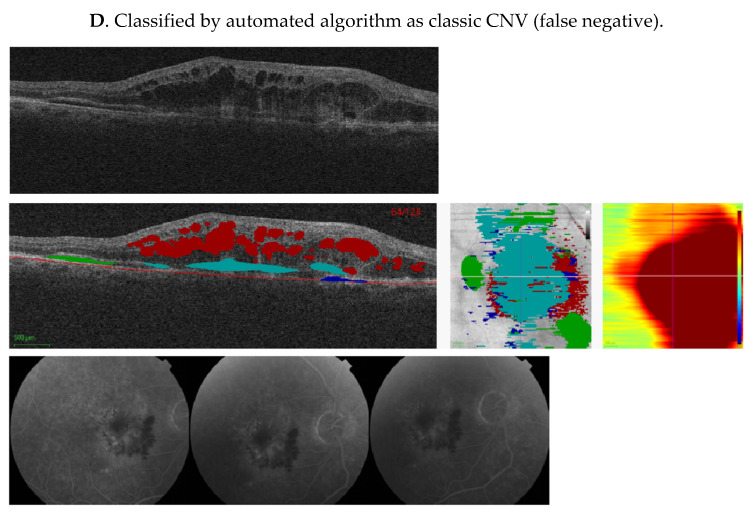
Figure 5.
Representative cases showing comparison of machine algorithm with angiography. (A–D) Central SD-OCT B-scans (top), with segmented pixel masks of volumetric measures and Bruch’s membrane (middle left), en-face projections (middle center), and thickness maps (middle right), as well as corresponding FAs (bottom). Colors on the SD-OCT images indicate volumetric measures as follows—intraretinal fluid (red), subretinal fluid (green), PED (blue), and SHRM (cyan). Bruch’s membrane is shown as a red line. In (A), FA shows an area of hypofluorescence due to hemorrhage, and a well-demarcated area of hyperfluorescence due to a predominantly classic CNV that leaks in later frames. This was also identified as classic CNV by our ML algorithm, due to increased SHRM height and volume. In (B), FA demonstrates an ill-defined area of stippled hyperfluorescence, due to an occult CNV that leaks diffusely in mid and late frames, and was also identified as occult CNV by the ML algorithm, due to the presence of the PED. In (C), FA shows an area of well-defined hyperfluorescence in mid frames that stains and leaks in late frames due to fibrosis. The image was classified as classic CNV by the reading center, but was identified as occult CNV by the ML algorithm due to low SHRM height and volume. In (D), FA shows an area of hypofluorescence due to hemorrhage and a poorly demarcated area of hyperfluorescence due to the CNV. This lesion was defined as minimally classic by the reading center, but was identified as classic CNV by the ML algorithm due to the SHRM created by the hemorrhage. CNV, choroidal neovascularization; FA, fluorescein angiogram; ML, machine learning; PED, pigment epithelium detachment; SD-OCT, spectral-domain optical coherence tomography; and SHRM, subretinal hyperreflective material.


