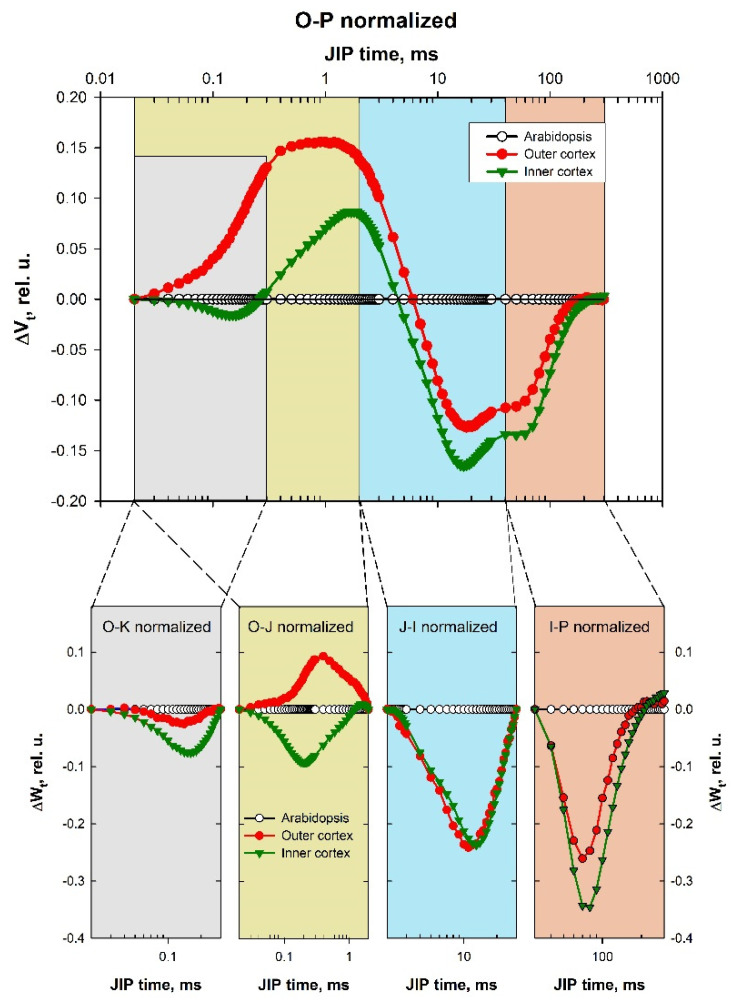
Figure 4.
Difference curves showing differences in IC of PF between the gall cortex (inner or outer) and the reference plants A. thaliana. Each DC value was calculated as a difference between the values of the relative variable fluorescence [Vt = (Ft − FO)/(FM − FO)] in the gall cortex minus the respective values for the leaves of the reference plants A. thaliana [ΔVt = Vt(cortex) − Vt (A. thaliana)]. The four characteristic bands are marked with different colors (A). The four lower panels (B–E) represent the difference curves calculated for each band separately (ΔWt). The equations for the calculations of the respective ΔWt are presented in Materials and Methods.

