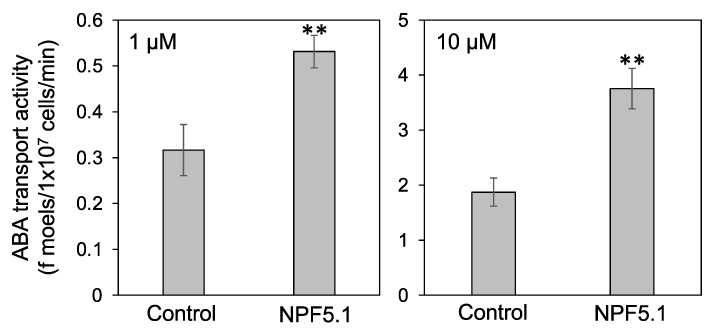
Figure 5.
ABA transport activity of NPF5.1. The amounts of ABA (f moels/1 × 107 cells/min) taken into yeast cells expressing NPF5.1 or control cells containing an empty vector were determined when the substrate concentration was 1 or 10 μM. Results are presented as mean ± SD of three biological replicates. ** Significantly different compared with the values in the control cells (p < 0.001) by Student’s t-test.

