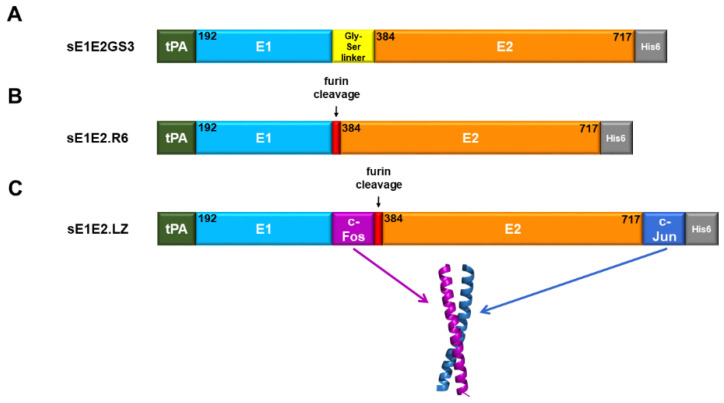
Figure 11.
Design of selected sE1E2 constructs. (A). Schematic of sE1E2GS3. (B). Schematic of sE1E2.R6. (C). Schematic of sE1E2.LZ and the X-ray structure of the human c-Fos/c-Jun heterodimer (PDB code: 1FOS); only the coiled-coil region that was used for the sE1E2.LZ scaffold is shown. c-Fos and c-Jun chains were colored to match the diagram of sE1E2.LZ. Regions shown include the tPA signal sequence (green), E1 ectodomain (cyan), E2 ectodomain (orange), Gly-Ser linker (yellow), and c-Fos and c-Jun scaffolds (magenta and blue). Location of the His tag (gray) and furin cleavage site (red) is indicated where applicable. E1E2 residue ranges for each region are noted according to H77 numbering.

