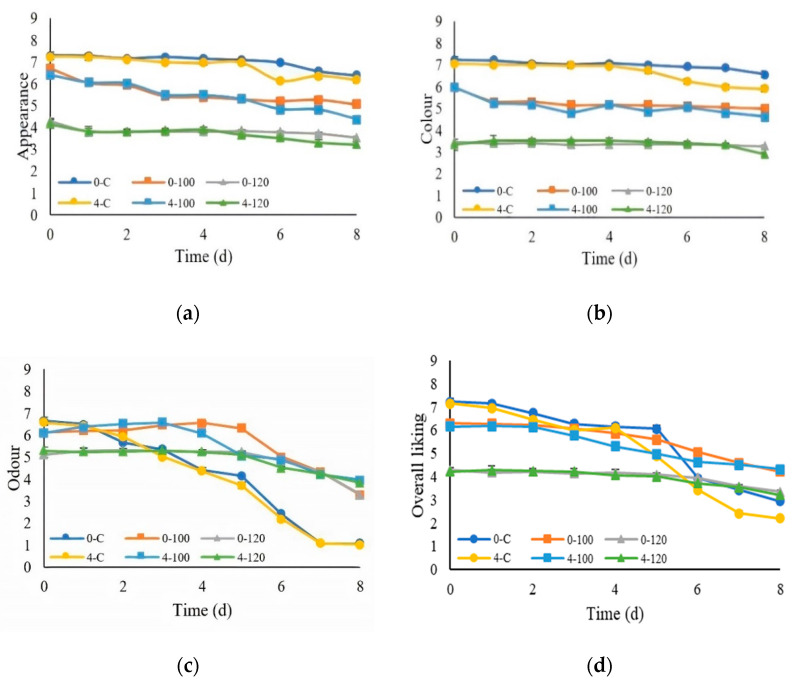
Figure 7.
Means and standard errors of the sensory scores from the 9-point hedonic scores of the pork samples: (a) appearance, (b) color, (c) odor, and (d) overall liking. (0-C = nondipped sample at 0 °C, 0-100 = 100-mg/mL dipped sample at 0 °C, 0-120 = 120-mg/mL dipped sample at 0 °C, 4-C = nondipped sample at 4 °C, 4-100 = 100-mg/mL dipped sample at 4 °C, and 4-120 = 120-mg/mL dipped sample at 4 °C.)

