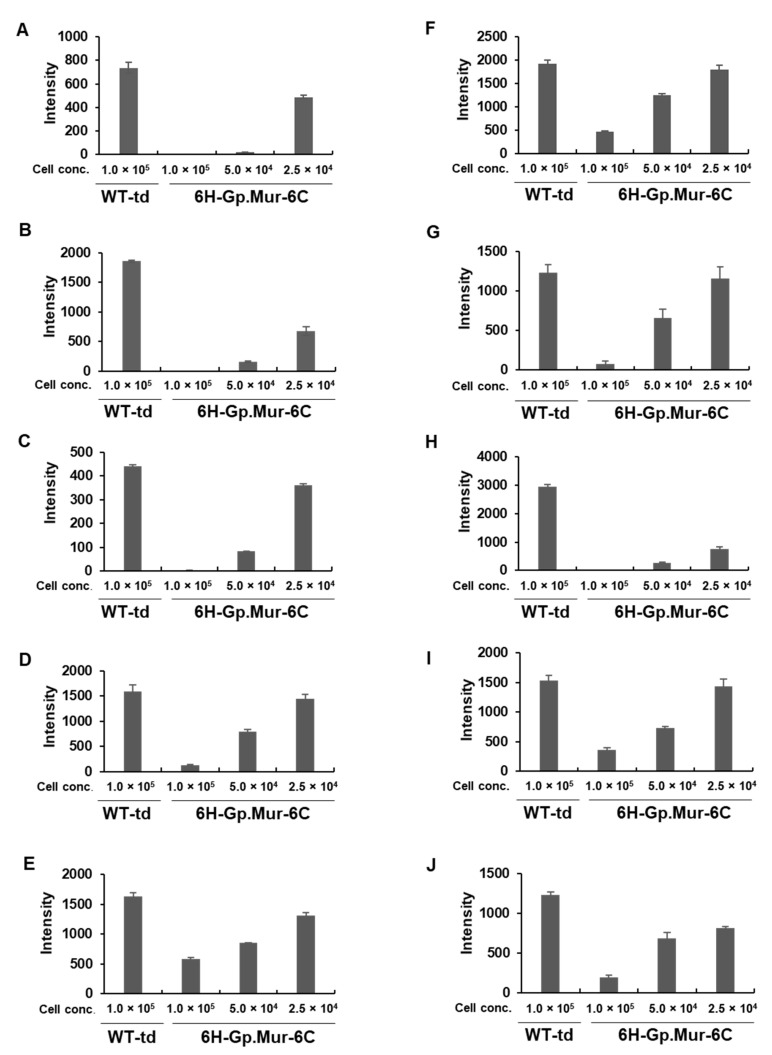
Figure 4.
Quantification of hemagglutination by means of densitometry. Samples (A–J) were subjected to densitometric analysis. After grading the hemagglutination in samples according to the conventional tube method, the RBC agglutinates were carefully loaded onto 96-well plates and subjected to densitometric analysis. Letters correspond to the same samples used for the conventional tube method (Figure 3). X axis reflects the cell concentrations (cell conc.) of the adsorbing cells (WT-td and 6H-Gp.Mur-6C), while the Y axis reflects the signal intensity as measured by the densitometric analysis.

