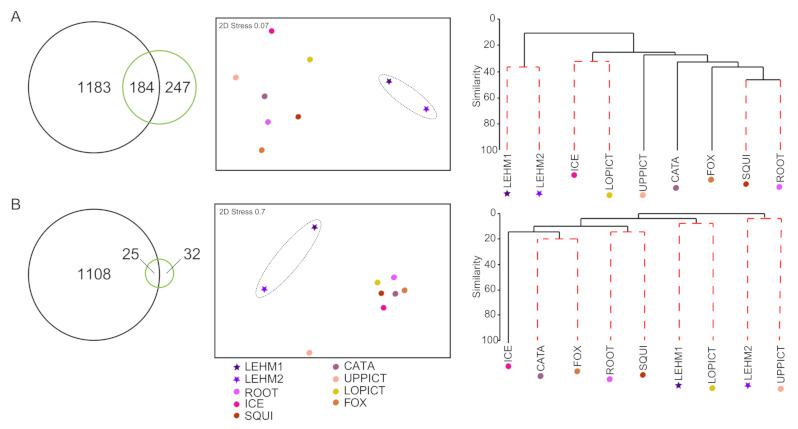
Figure 6.

Comparison of bacterial (A) and fungal communities (B) in Lehman Caves (show cave) with wild caves. In the Venn diagrams on the left-hand side of each panel, OTUs from the Lehman Caves samples (“LEHM 1” and “LEHM 2”) were combined and are shown with green circles; similarly, OTUs from the seven wild caves were combined into a single composite “wild caves” sample and are shown in black circles. NMDS plots are shown in the center of each panel. Cluster diagrams are on the right-hand side of each panel, with red dashed lines indicating statistically different groups. The show cave with artificial lighting, Lehman Cave, was represented by two composite samples: “LEHM 1” collected in May 2019 from 10 sites within the cave; and “LEHM 2” collected from five sites within the cave in November 2019.
