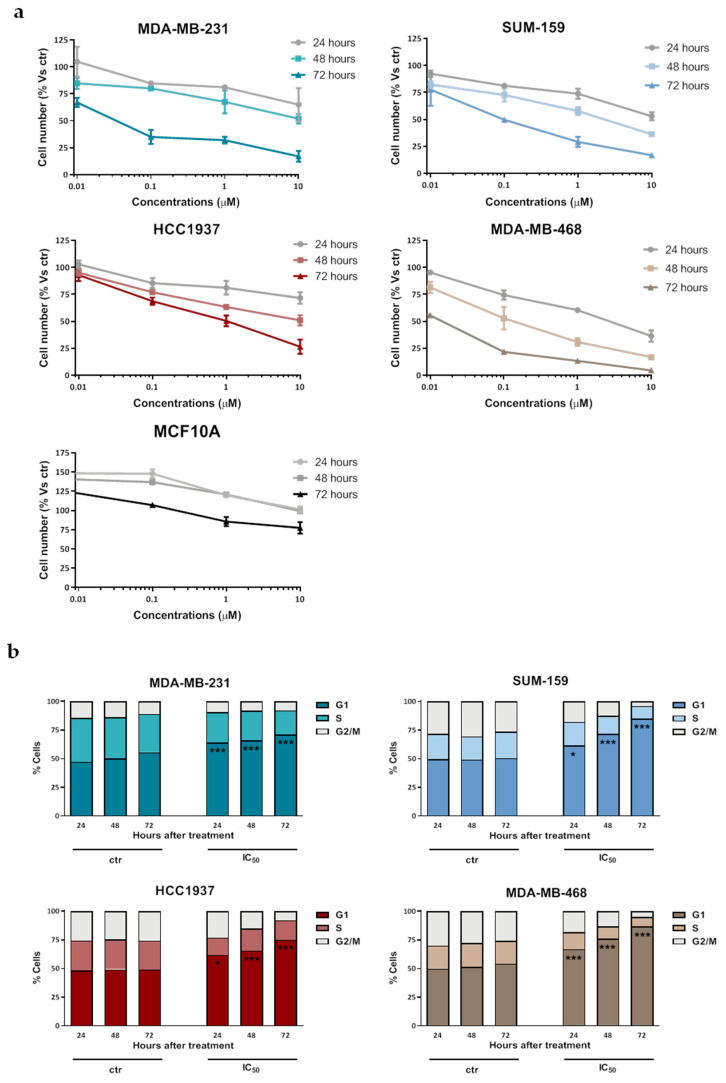
Figure 1.
Effect of selinexor on cell growth and cell cycle distribution of TNBC cell lines. (a) MDA-MB-231, SUM-159, HCC1037, MDA-MB-468 cells and human normal breast cells (MCF-10A) were cultured for different time intervals in the presence of increasing concentrations of selinexor or 0.1% (v/v) DMSO (control cells; ctr), and the cytotoxic activity was assessed by MTS assay. Data are expressed as the percentage of cells (mean values ± SD of three independent experiments) in each conditions with respect to control cells (ctr). (b) Flow cytometric analysis of cell cycle distribution in TNBC cells exposed to 0.1% (v/v) DMSO (control cells; ctr) and selinexor (IC50 at 72 h, as reported in Table 1). Data are reported as the percentage of cells in G1, S, and G2/M phases and represent the mean values of three independent experiments; SDs were always within 5%. Only G1 phase comparisons were explicited. * p < 0.05, *** p < 0.005 Tukey’s post hoc test.

