Figure 1.
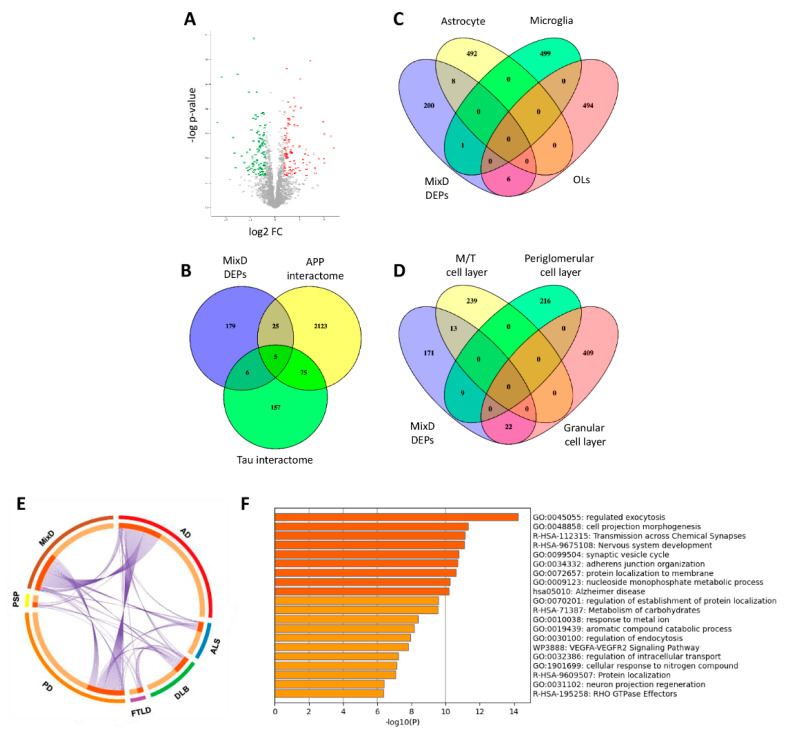
Olfactory proteome-wide analysis in MixD. (A) Volcano plot indicating the statistically significant DEPs represented in red (upregulation) and green (downregulation). (B) Venn diagram showing the overlap between OB DEPs and experimentally demonstrated APP and Tau interactors. (C) Cluster-enriched genes in specific brain cells that are differentially expressed in the OB from MixD subjects. (D) Cluster-enriched genes in specific OB cell layers that are deregulated in MixD at the level of the OB. (E) Circos plot representing commonalities in DEPs (purple lines) between MixD and different neurological phenotypes: AD, Parkinson’s disease (PD), Dementia with Lewy Bodies (DLB), Progressive supranuclear palsy (PSP), Amyotrophic lateral sclerosis (ALS), frontotempral lobar degeneration TDP-43 proteinopathy (FTLD-TDP43). (F) Top-20 statistically enriched terms from MixD DEPs generated by Metascape.

