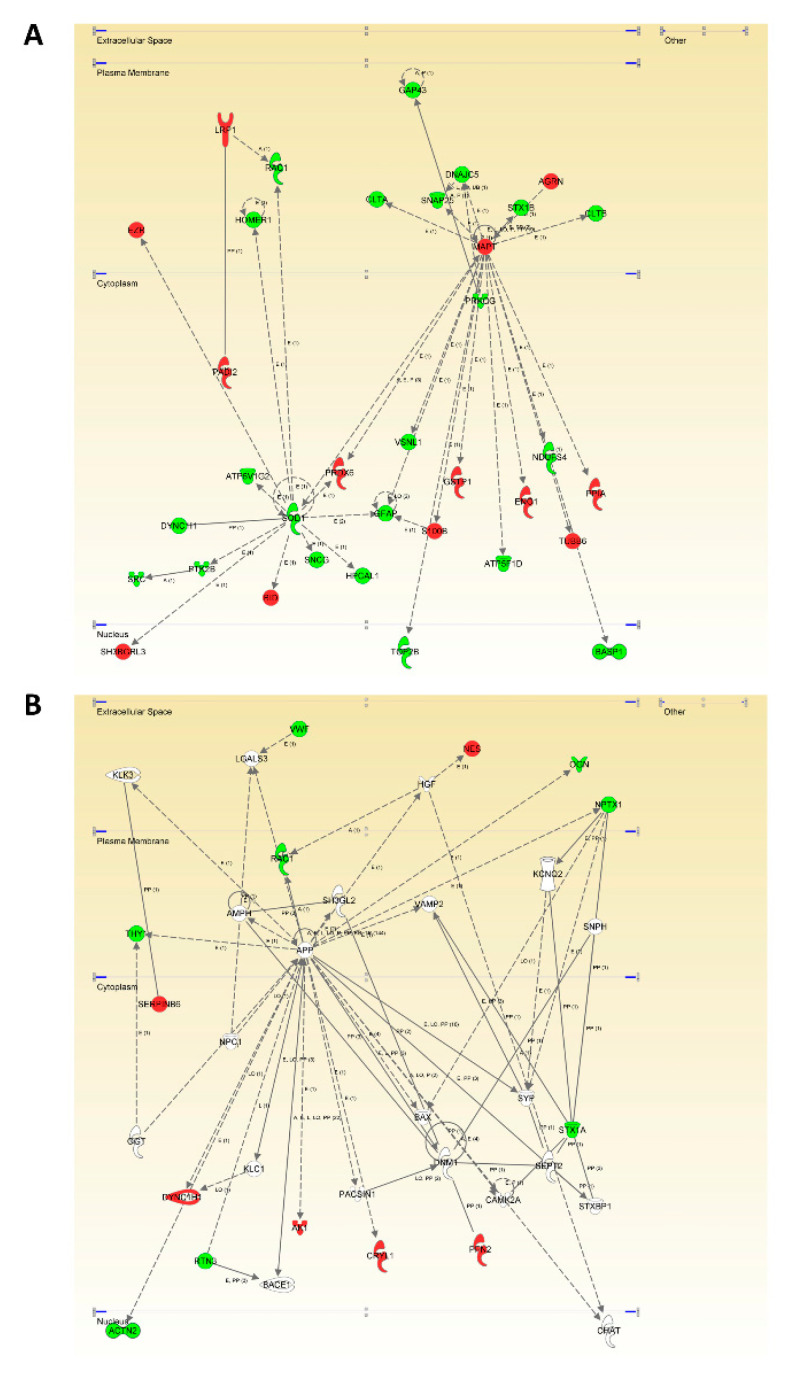
Figure 2.
OB Modulation of the MAPT (A) and APP (B) functional interactomes in MixD. Relationships between DEPs and potential neuropathological substrates are represented by continuous lines (direct interactions) or discontinuous lines (indirect functional interactions). Up-regulated and down-regulated proteins are marked in red and green, respectively (for complete legend interpretation, see Supplementary File S1.

