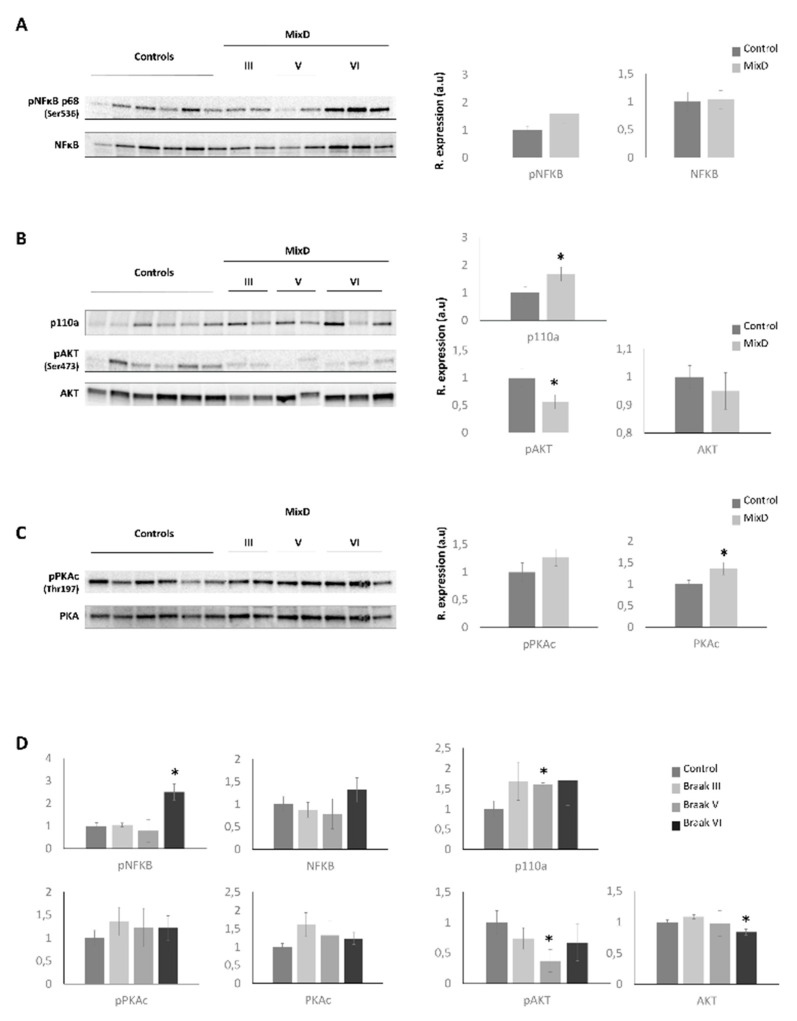
Figure 4.
Monitoring of the specific signaling modulators that appeared as principal nodes in our protein interactome maps. Levels and phosphorylation of NFκB (A), p110a, AKT (B), and PKAc (C) were analyzed across MixD OB samples. Analysis was also performed separating MixD group by Braak staging (D), (* p < 0.05 versus control group).

