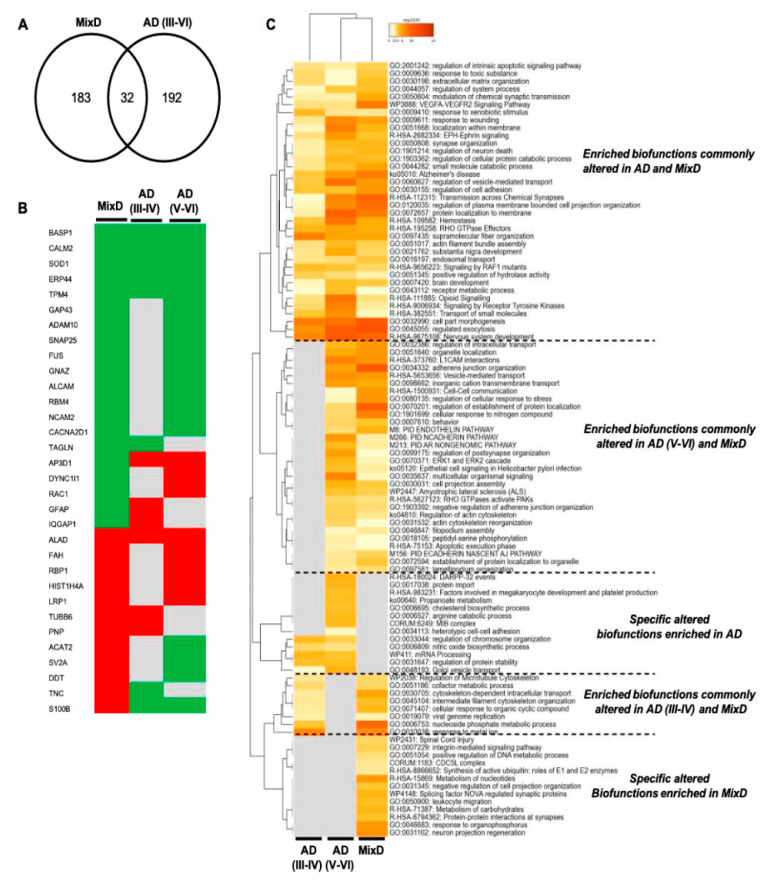
Figure 5.
Comparative analysis between differential OB proteomes across AD and MixD. (A) Venn diagram showing the overlap od DEPs detected in AD (Braak stages III-VI) and MixD phenotypes. (B) OB Protein expression profile of the 32 common deregulated proteins between AD and MixD (green: downregulated; red: upregulated; grey: not differentially expressed). (C) Commonalities and differences observed in the significantly altered functional profile between AD and MixD phenotypes.

