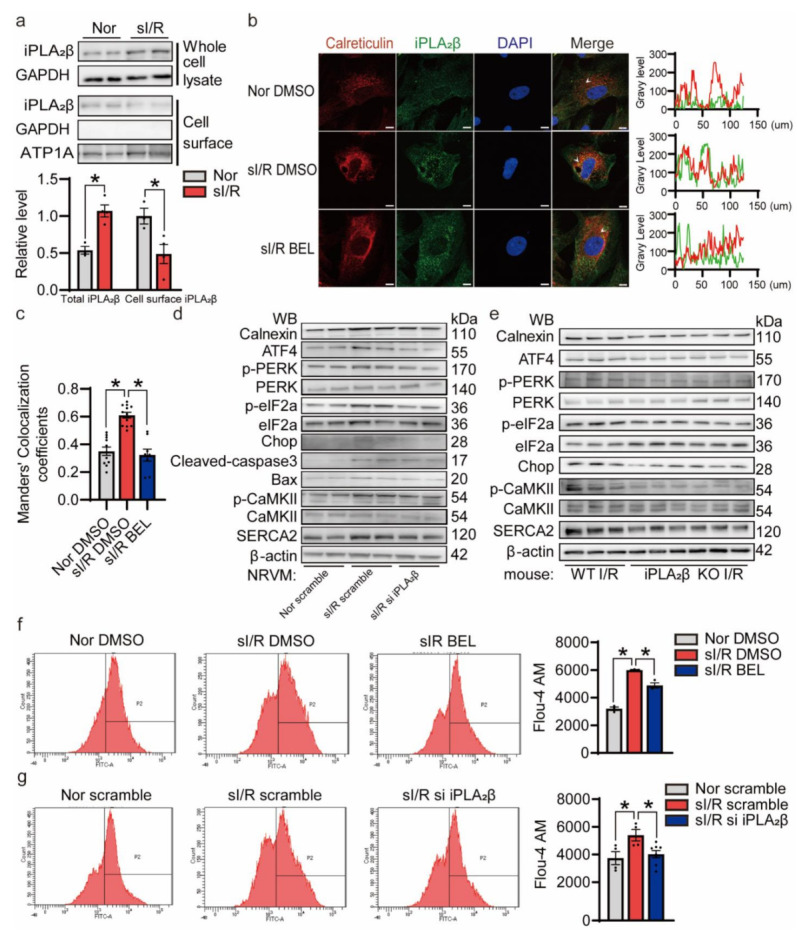
Figure 6.

I/R promotes iPLA2β translocate to the ER, leading to cardiomyocyte apoptosis induced by ER stress. (a) sI/R caused no significant increase in iPLA2β on the cell surface membrane. NRVMs were subjected to sI/R and then placed on ice. EZ-link Sulfo-NHS-LC-Biotin was used to modify cell surface-localized proteins. After isolation of biotinylated surface proteins with neutravidin, immunoblotting was conducted to detect iPLA2β. ATP1A was used as loading control of cell-surface-localized proteins. Quantification (below) revealed no increase in cardiomyocyte surface-localized iPLA2β after sI/R. n = 3–4 for each group. (b) iPLA2β was localized in the ER. iPLA2β was detected by confocal immunofluorescence staining (green). ER was revealed by confocal immunofluorescence staining for calreticulin (red). The areas of interest are labeled with white arrows. The signaling intensity for both channels was scanned and recorded. Results are shown on the right. Scale bar = 20 μm. (c) Colocalization of iPLA2β and ER was quantified by Mander’s colocalization coefficients (MCCs). The comparison suggests that the inhibition of iPLA2β significantly disrupts iPLA2β and ER colocalization. n = 8–12 per group. (d) Knockdown of iPLA2β relieved ER stress caused by I/R. Immunoblotting analysis was performed to detect the ER stress markers and Ca2+ -regulated related proteins. β-actin was used as a loading control. The protein levels of calnexin, ATF4, p-PERK, p-eIF2a, CHOP, cleaved-caspase3, Bax, p-CaMKII and SERCA2 were downregulated in the siiPLA2β -transfected NRVMs. (e) Knockout of iPLA2β relieved the ER stress caused by I/R. Immunoblotting analysis of ER stress markers and Ca2+-regulated related proteins were performed. β-actin was used as a loading control. The protein levels of calnexin, ATF4, p-PERK, p-eIF2a, CHOP, p-CaMKII and SERCA2 were downregulated in the Pla2g6 KO mouse heart tissues. (f) Inhibition of iPLA2β by BEL reduced calcium overload upon sI/R. Intracellular Ca2+ was measured using 5 μM Fluo-4 AM. Mean fluorescence intensity indicates the concentration of intracellular Ca2+. Quantification is shown on the right. n = 3 per group. (g) Knockdown of iPLA2β reduced calcium overload during sI/R. Intracellular Ca2+ was measured using 5μM Fluo-4 AM. Mean fluorescence intensity indicates the concentration of intracellular Ca2+. Quantification is shown on the right. n = 4–7 per group. Data are represented as the mean ± SEM. All experiments were independently replicated in triplicate. * p < 0.05.
