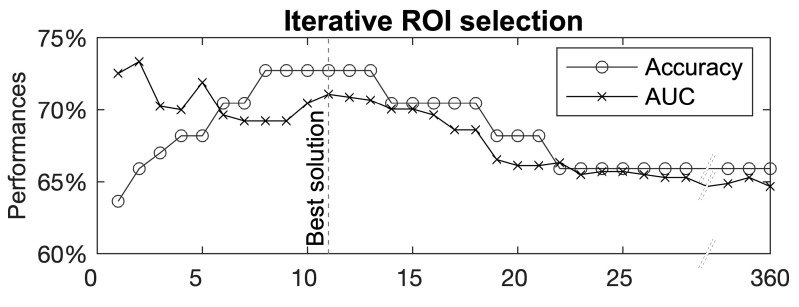
Figure 1.
Post hoc analysis to select the subset of ROIs that contributed most to the classification. The X-axis reports the number of ROIs used for the classification. The Y-axis reports classification performance scored with that set of ROIs. ROIs are iteratively removed from the lowest to the highest weight, which was assigned by assessing all of them. The red dashed line indicates the best configuration.

