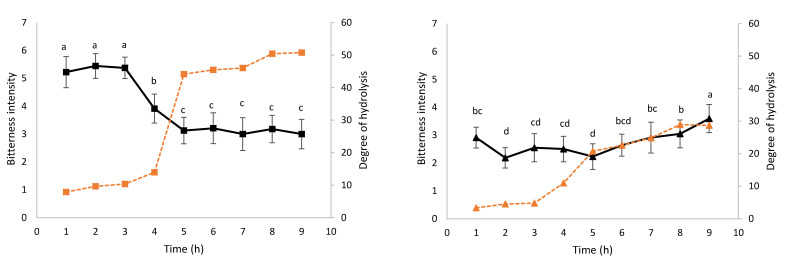
Figure 1.
Evolution of bitterness and DH during hydrolysis kinetics 109 (a) and 125 (b). The black kinetics 109 (■) and kinetics 125 (▲), respectively. The dotted orange lines represent the evolution of DH for kinetics 109 (■) and kinetics 125 (▲), respectively. The bitterness intensity values from 1 (low) to 7 (high) are means +/− standard deviation (n = 2): the different letters (a, b, c) indicate means that significantly differ among the nine samples at p ≤ 0.05 according to Duncan’s multiple range test.

