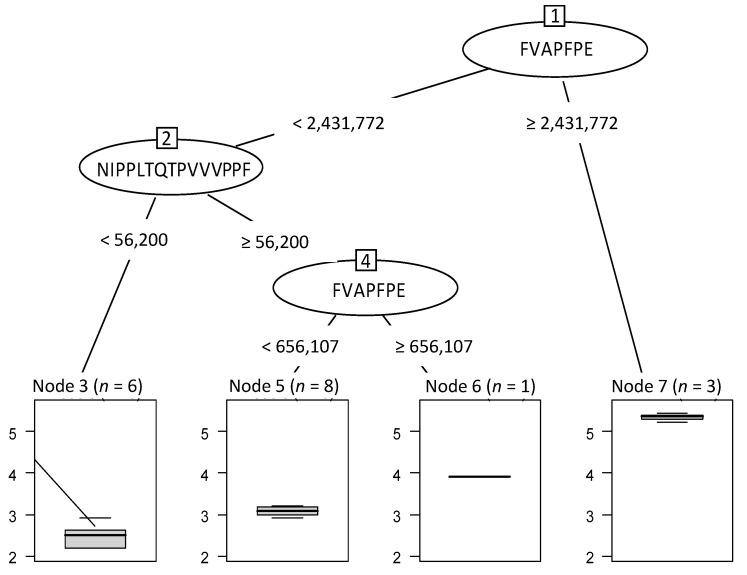
Figure 7.
Optimal regression tree built to predict the hydrolysate bitterness from the 22 identified peptides. The boxplots represented below the tree show the intensity and the gradual evolution of bitterness. n = number of hydrolysates for each group defined by a different level of bitterness with sample reference number. Node 3 (n = 6) corresponds to hydrolysates 125-1, -2, -3, -4, -5 and -6; Node 5 (n = 8) corresponds to hydrolysates 125-7, -8, -9/109-5, -6, -7, -8 and -9; Node 6 (n = 1) corresponds to hydrolysate 109-4; Node 7 (n = 3) corresponds to hydrolysates 109-1, -2 and -3.

