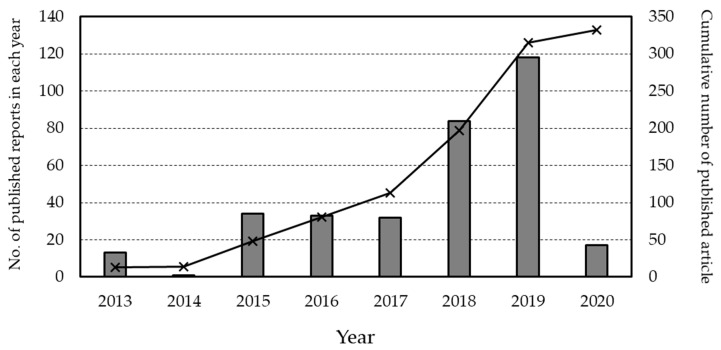
Figure 1.
Number of new reports related to brain organoid research from 2013 to 2020. The bar graph shows the number of published reports in each year and the line graph represents the cumulative number of published reports. As 2013 is the first year of brain-organoid research-related news report publication, the timeline after that year has been drawn. The number of published articles in 2020 is included up to April.

