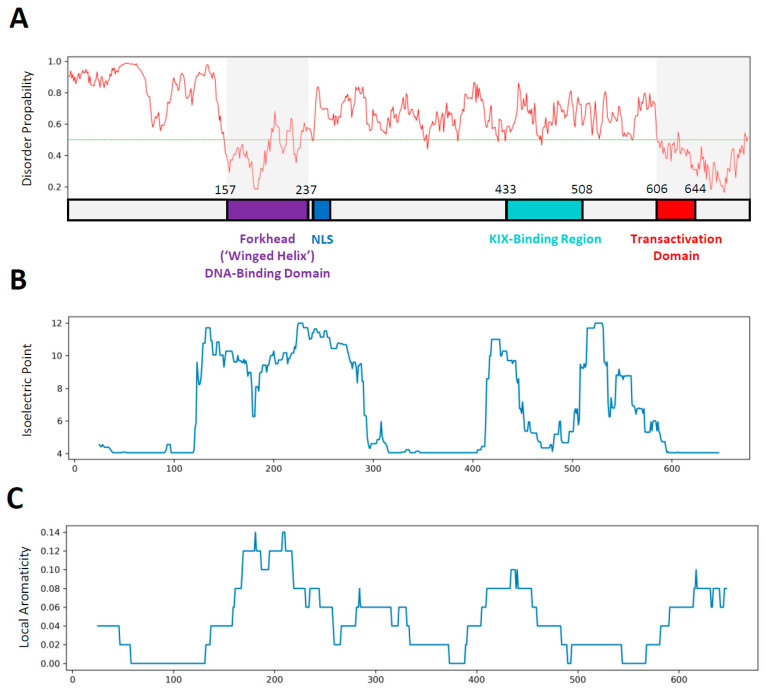
Figure 1.
(A) Schematic diagram showing the distribution of known functional elements within the primary amino acid sequence of FOXO3 (annotation based on information associated with the NCBI reference sequence NP_963853.1). The start and end positions of several named elements (DNA-Binding Domain (purple), KIX-Binding Region (green) and the transcriptional Transactivation Domain are shown in the diagram). The start and end position of the nuclear localization sequence (NLS, dark blue) are 242 and 259, respectively. The top half of the panel shows the result of an IUPred2A analysis [14] of FOXO3. The red line indicates the probability of residues in that position to participate in a disordered structure. The green line indicates the cut-off point: residues below are considered structured. These values are congruent with the MobiDB-lite scores that predict an overall disorder of ~60% based on multiple criteria and methods (https://mobidb.org/ accessed on 18 May 2021; [15]). (B) Local isoelectric point analysis using a sliding window size of 25 residues. The calculated isoelectric value for each window is plotted according to the position of the center of the window. (C) Local aromaticity analysis using a sliding window size of 25 residues. The calculated hydrophobicity value (based on the proportion of large aromatic amino acids (Phe, Trp, Tyr) in the window) is plotted according to the position of the center of the window.

