Figure 2.
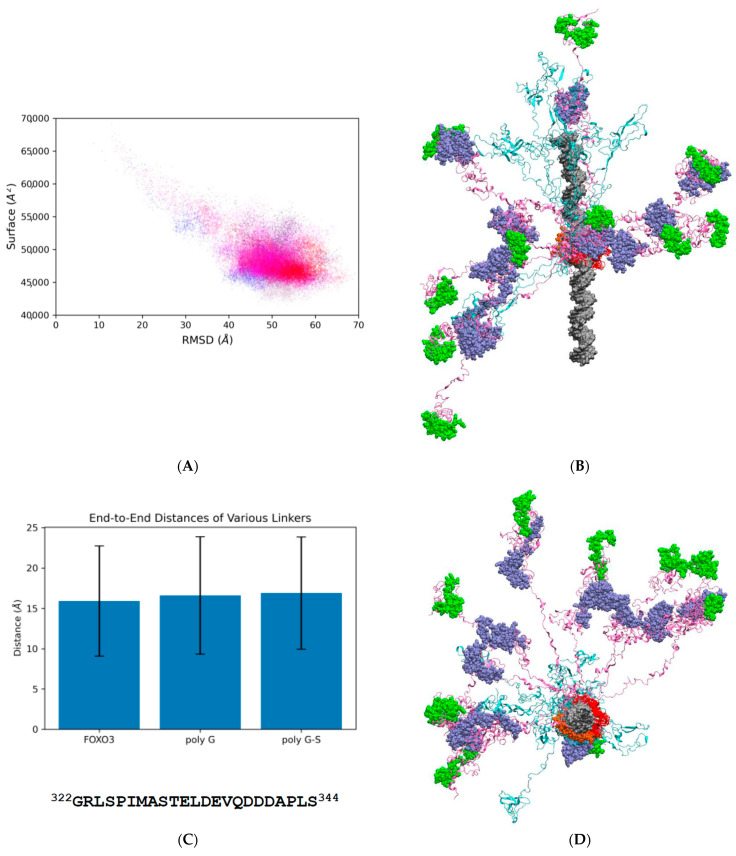
(A) Characterization of the molecular dynamics results using global variables (root mean square deviation [RMSD] and solvent accessible surface). The starting structure is located in the top left corner and the dots moving diagonally towards the lower right corner represent intermediate structures formed during the earliest stages of the simulations. All ten simulations finally generate structures that populate a dense space in the lower right corner. Each of the dots (different shades of red, blue, and purple represent different simulations) corresponds to the measurements from a single structure (‘snapshot’) sampled at 100 picosecond intervals in the trajectories (see Figure S3 for a Gaussian kernel density representation of this result). (B) Superimposition of snapshots representing the final structure (at 500 ns) from each of the 10 independent molecular dynamics simulations. The structures were aligned using the stably folded DNA binding motif (FOXO3157−237). The DNA is shown as a silver surface structure. The DNA-binding domain (DBD) is shown as a red cartoon and the nuclear localization sequence in orange van der Waals representation. The intrinsically disordered region (IDR) located N-terminally to the DBD is shown as a cyan cartoon model, and the IDR located C-terminally to the DBD as a pink cartoon model. The KIX-Binding Region is shown as blue van der Waals spheres, and the Transactivation Domain as green spheres. See also Video S1 for a rotating version of the structure for more details and to obtain a three-dimensional understanding of this figure. (C) Bar chart of the end-to-end distances of a segment of the flexible linker of FOXO3 (FOXO3322-344, sequence shown below) in comparison to a polypeptide of the same length consisting of glycine residues (‘polyG’) or alternating glycine-serine residues (‘polyG-S’) (D) Same structure as in (B), but viewed down the central axis of the DNA.

