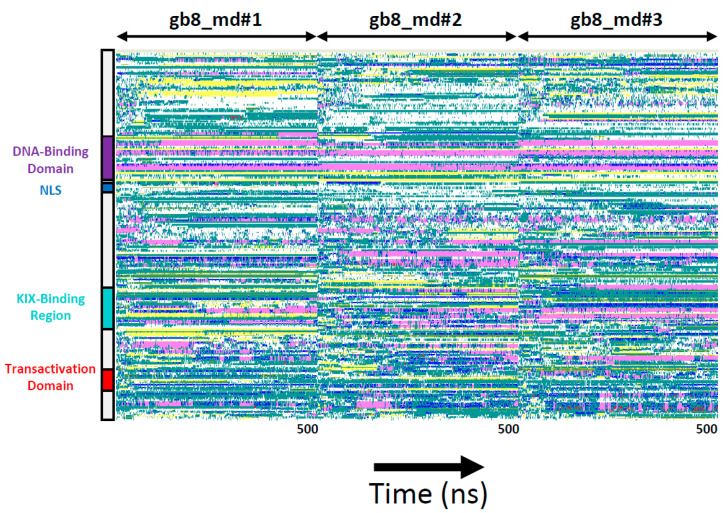
Figure 3.
Distribution of secondary structure elements in molecular dynamics (MD) simulations. The distribution of secondary structure elements is shown for the first three MD simulations as representative examples (gb8_md#1, gb8_md#2, gb8_md#3). The vertical axis represents the primary amino acid positions, highlighting functionally relevant domains as colored boxes). The horizontal axis represents simulation time (1–500 nanoseconds (ns) for each of the three independent simulations). The data are represented in concatenated format to allow direct comparison between the different trajectories. The color codes represent the secondary structures formed in each simulation frame at each position of the primary amino acid sequence (pink, α-helix; dark blue, π-helix; yellow, extended conformation; cyan, turn; white, coil). Data visualized with VMD [34].

