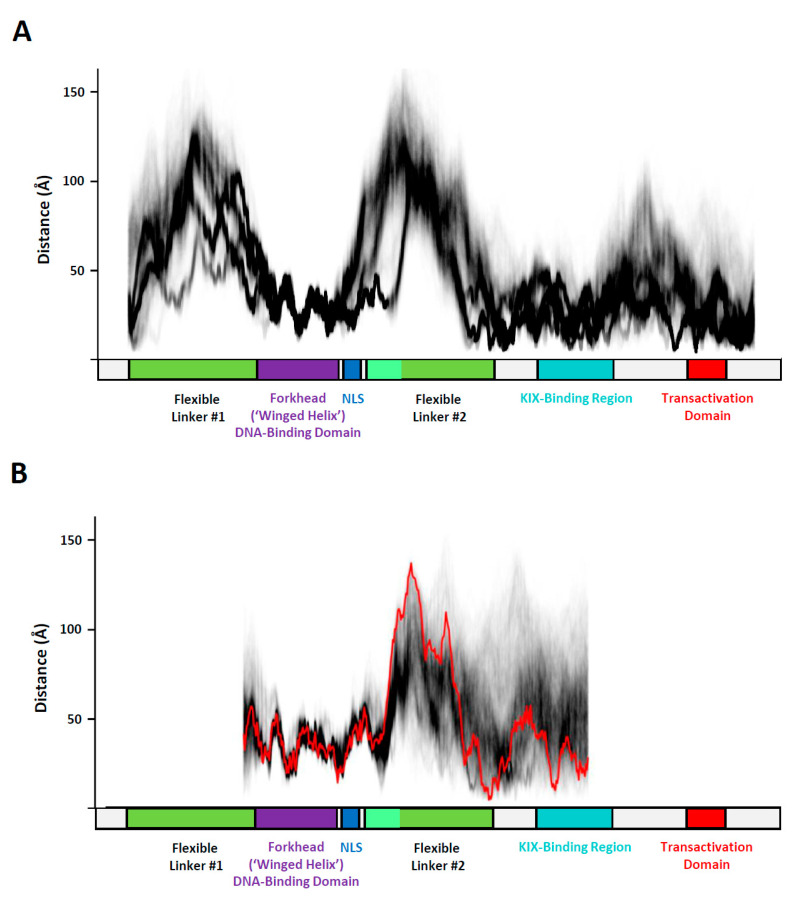
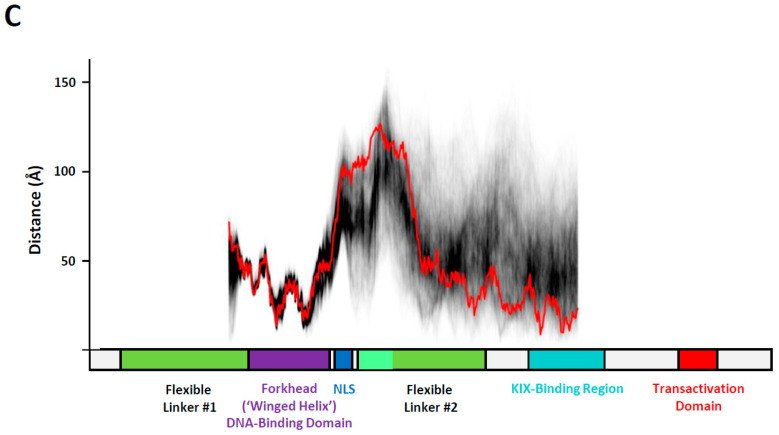
Figure 5.
Local compaction plots (LCPs) of FOXO3 molecular dynamics (MD) simulation data. (A) LCP analysis of the FOXO3 MD simulation data. The sliding window size for the intramolecular distance measurements is fixed at 75 amino acids. The distance (in Å) between the residues at position 1 and 75 of the window is determined using cpptraj (AMBER simulation package; [32]) for all snapshots of the trajectories. The window is then moved to a new position shifted by one residue. The FOXO3 DNA-binding domain (residues 157 to 237, shown as a purple box) is stably folded and therefore all distance measurements within (and immediately adjacent to it) are quite constant, short (<50 Å) and superimposable on each other to form a dense black line. In contrast, the ‘Flexible Linkers’ (FL) are distinctly recognizable in the LCP because of the large distances (50–150 Å) identified in the sliding 75 amino acid windows and their more diffuse appearance due to the presence of alternative conformations. (B) LCP of the aMD simulation data of FOXO3120−530 using the final frame of gb8_md#1 containing FL#2-A in a compact conformation. The LCP trace of the starting structure is shown in red and the traces of the aMD simulations reflecting 100 ns in black. (C) LCP of the aMD simulation data of FOXO3 120–530 using the final frame of gb8_md#1 containing FL#2-A in an extended conformation. The LCP trace of the starting structure is shown in red and the traces of the aMD simulations reflecting 100 ns in black.


