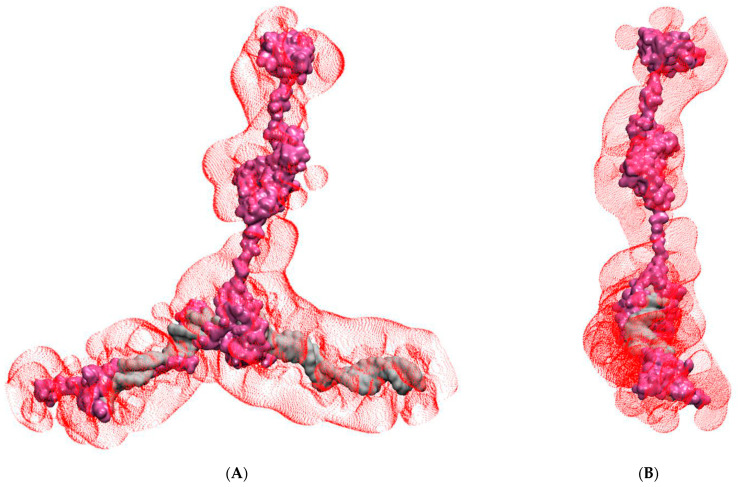
Figure 6.
Electrostatic surface of FOXO3 bound to DNA. (A) Frontal view of the isoelectric surface representation of the FOXO3-DNA complex. The structure of the FOXO3-DNA complex is shown in surface representation (DNA silver, FOXO3 purple). The red dotted surface represents the isosurface with an isovalue of 0.02. (B) Same as in (A) but rotated by 90° to allow viewing of the complex along the DNA axis.

