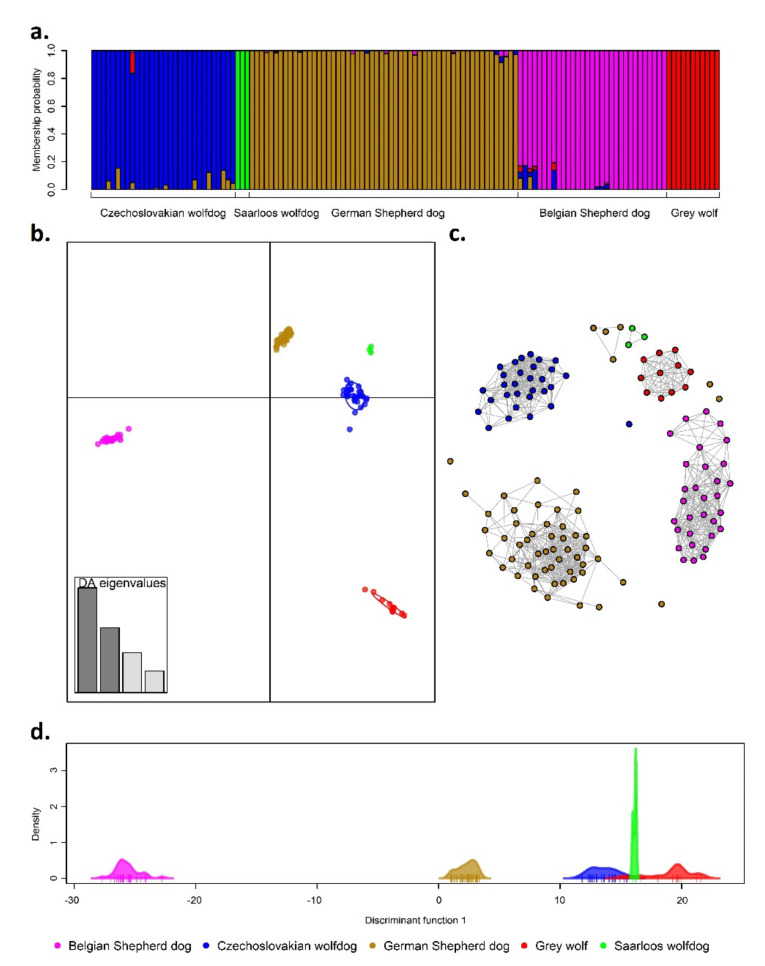
Figure 3.
Fine-scale population structure based on stacked barplot of the cluster membership suggested by the Bayesian algorithm (a), first two discriminant functions of supervised DAPC analysis (b), the mutual nearest-neighbour graph obtained from unsupervised clustering method (c), and the first discriminant function of DAPC analysis (d).

