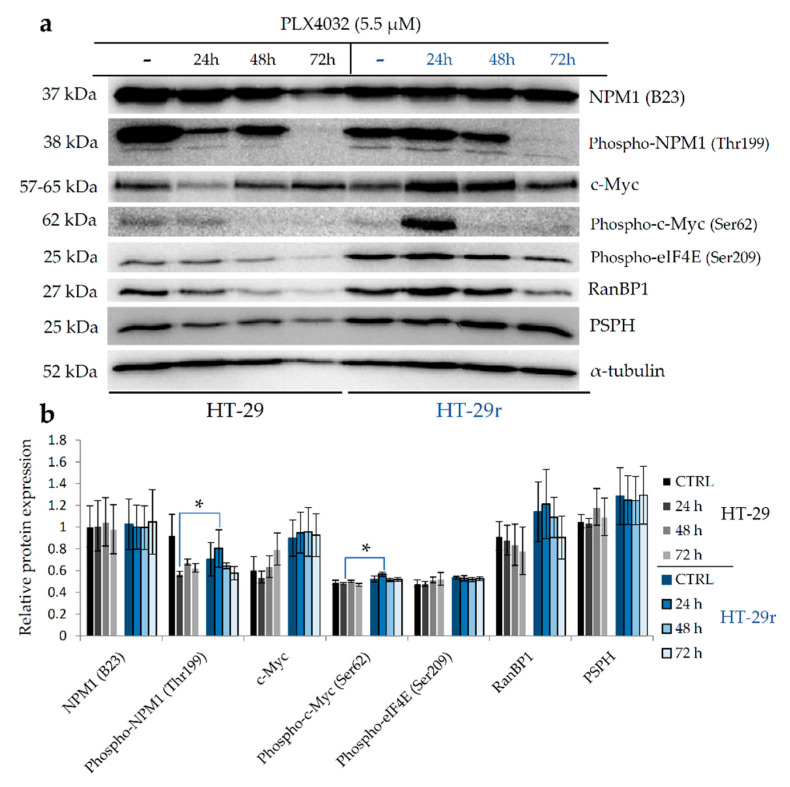
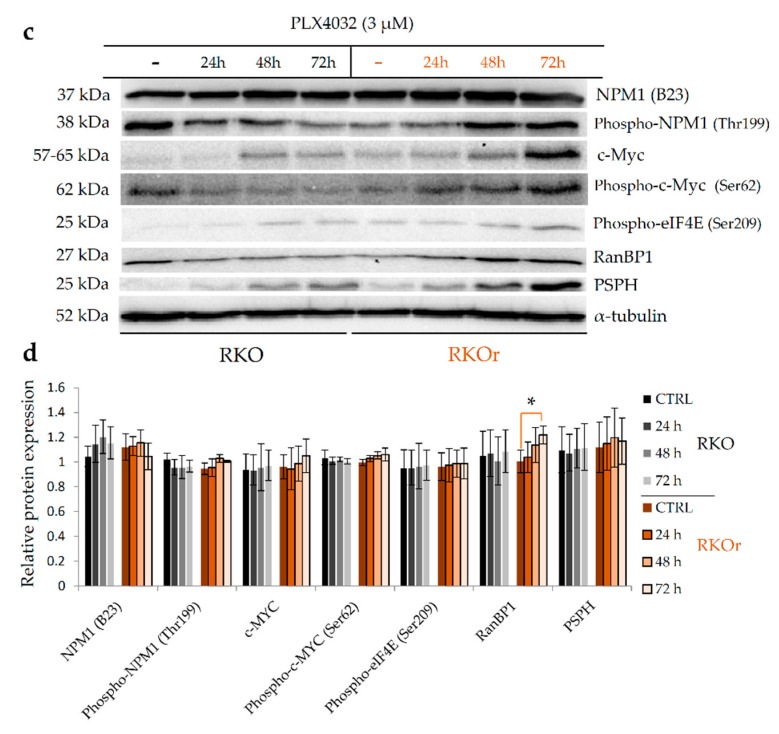
Figure 5.
Western blot analysis of relative expression of selected proteins in BRAFV600E-mutated HT-29 (a,b) and RKO (c,d) sensitive and vemurafenib (PLX4032)-resistant colon cancer cell lines following the exposure to cytotoxic concentrations of PLX4032 at different time points. Densitometry analysis of western blot bands was carried out by Quantity One software to calculate relative abundance of selected proteins in parental and resistant HT-29 (b) and RKO (d) cells. Data represent mean and standard deviation obtained from two independent biological experiments with two technical replicates. α-Tubulin was used as loading control. Statistical significance where p < 0.05 is denoted with an asterisk.


