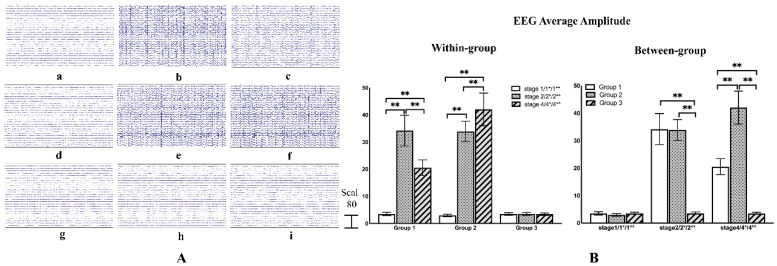
Figure 9.
(A) (a–c) Respectively represent the raw EEG data of Stage 1, Stage 2, and Stage 4 in Group 1. (d–f) Respectively represent the raw EEG data of Stage 1*, Stage 2*, and Stage 4* in Group 2. (g–i) Respectively represent the raw EEG data of Stage 1 **, Stage 3**, and Stage 4** in Group 3. (B) Within-group comparisons and between-group comparisons of EEG average amplitude. ** indicates significance (p < 0.01).

