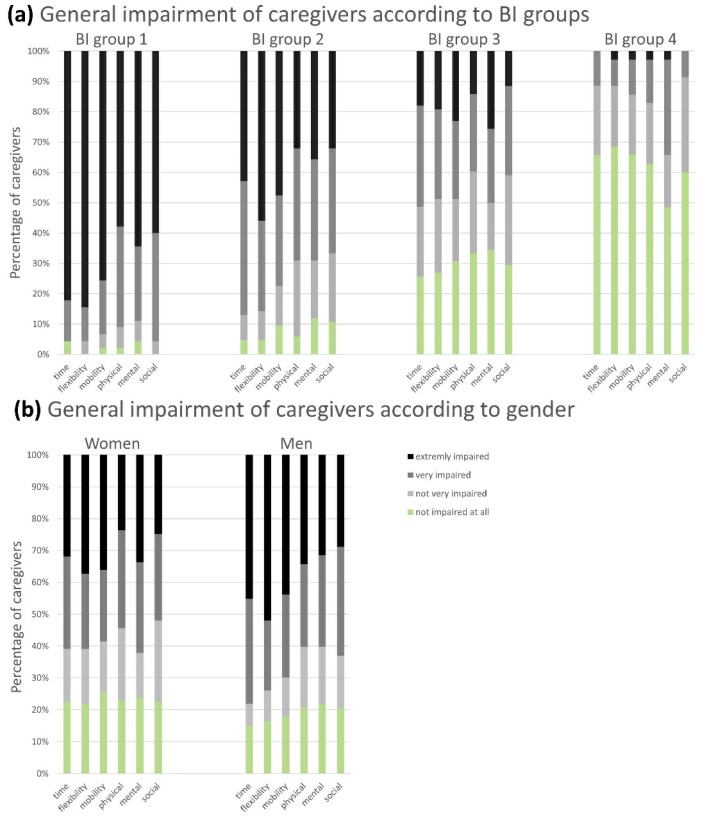
Figure 2.
General impairment of caregivers according to BI groups (a) and gender (b): The caregivers were able to indicate their perceived general impairment in different dimensions of their everyday life on a four-point Likert scale from “not impaired at all” to “extremely impaired”. Six adjacent columns are assigned to one distinct BI group (a) or gender (b). One column corresponds to one domain. The extent of the colored sections represents the percentage of answers provided by the CGs on the abovementioned scale. The proportion of “very/extremely” impaired CGs increased with the loss of autonomy of the patient (BI group 4 (= BI score 100 points = full independence) to BI group 1 (= BI score 0–20 points = full dependence)), and the number of “not very/not at all” restricted CGs correspondingly decreased (a), while no significant differences were observed according to the CGs’ gender (b). Abbreviations: BI = Barthel Index; CGs = caregivers.

