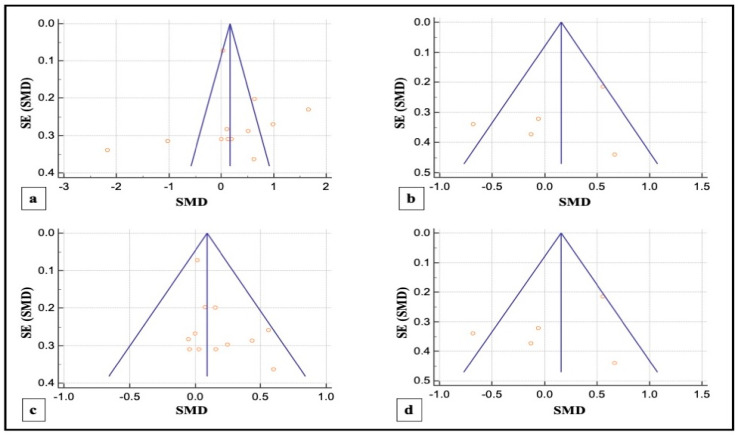
Figure 6.
(a,b) Funnel plots illustrating the publication bias in overall PPD reduction in SM and PG studies, respectively; (c,d) funnel plots illustrating the publication bias in overall CAL gain in SM and PG studies, respectively. Each circle represents a single included study, the y-axis and x-axis represent the standard error of the effect estimate and the results of the study respectively and the graphical plot resembles an inverted funnel with scatter due to sampling variations.

